
How to animate the history of U.S. statehood
Build a 44-second map timeline from the original thirteen states to Hawaii. Use timed state fills, chapter labels and three camera moves to explain how the U.S. reached 50 states.
Where the data came from
Table 1 of the Congressional Research Service statehood guide supplies the dates. For the original thirteen, those dates record ratification of the Constitution. For the other states, they record when admission took effect. We joined the 50 names to the Census Bureau’s 2024 cartographic state boundaries at 1:20 million scale, then counted the states after each chapter. The outlines are modern and the colors describe statehood, rather than historical territorial control.
The film was assembled as an editable Studio project and exported through the Studio engine. Open the U.S. statehood example in the homepage gallery and choose its template to inspect the same actions and timings. The frames and Studio captures below are from that English project.
Watch the result
1. Frame the lower 48 and introduce the original thirteen
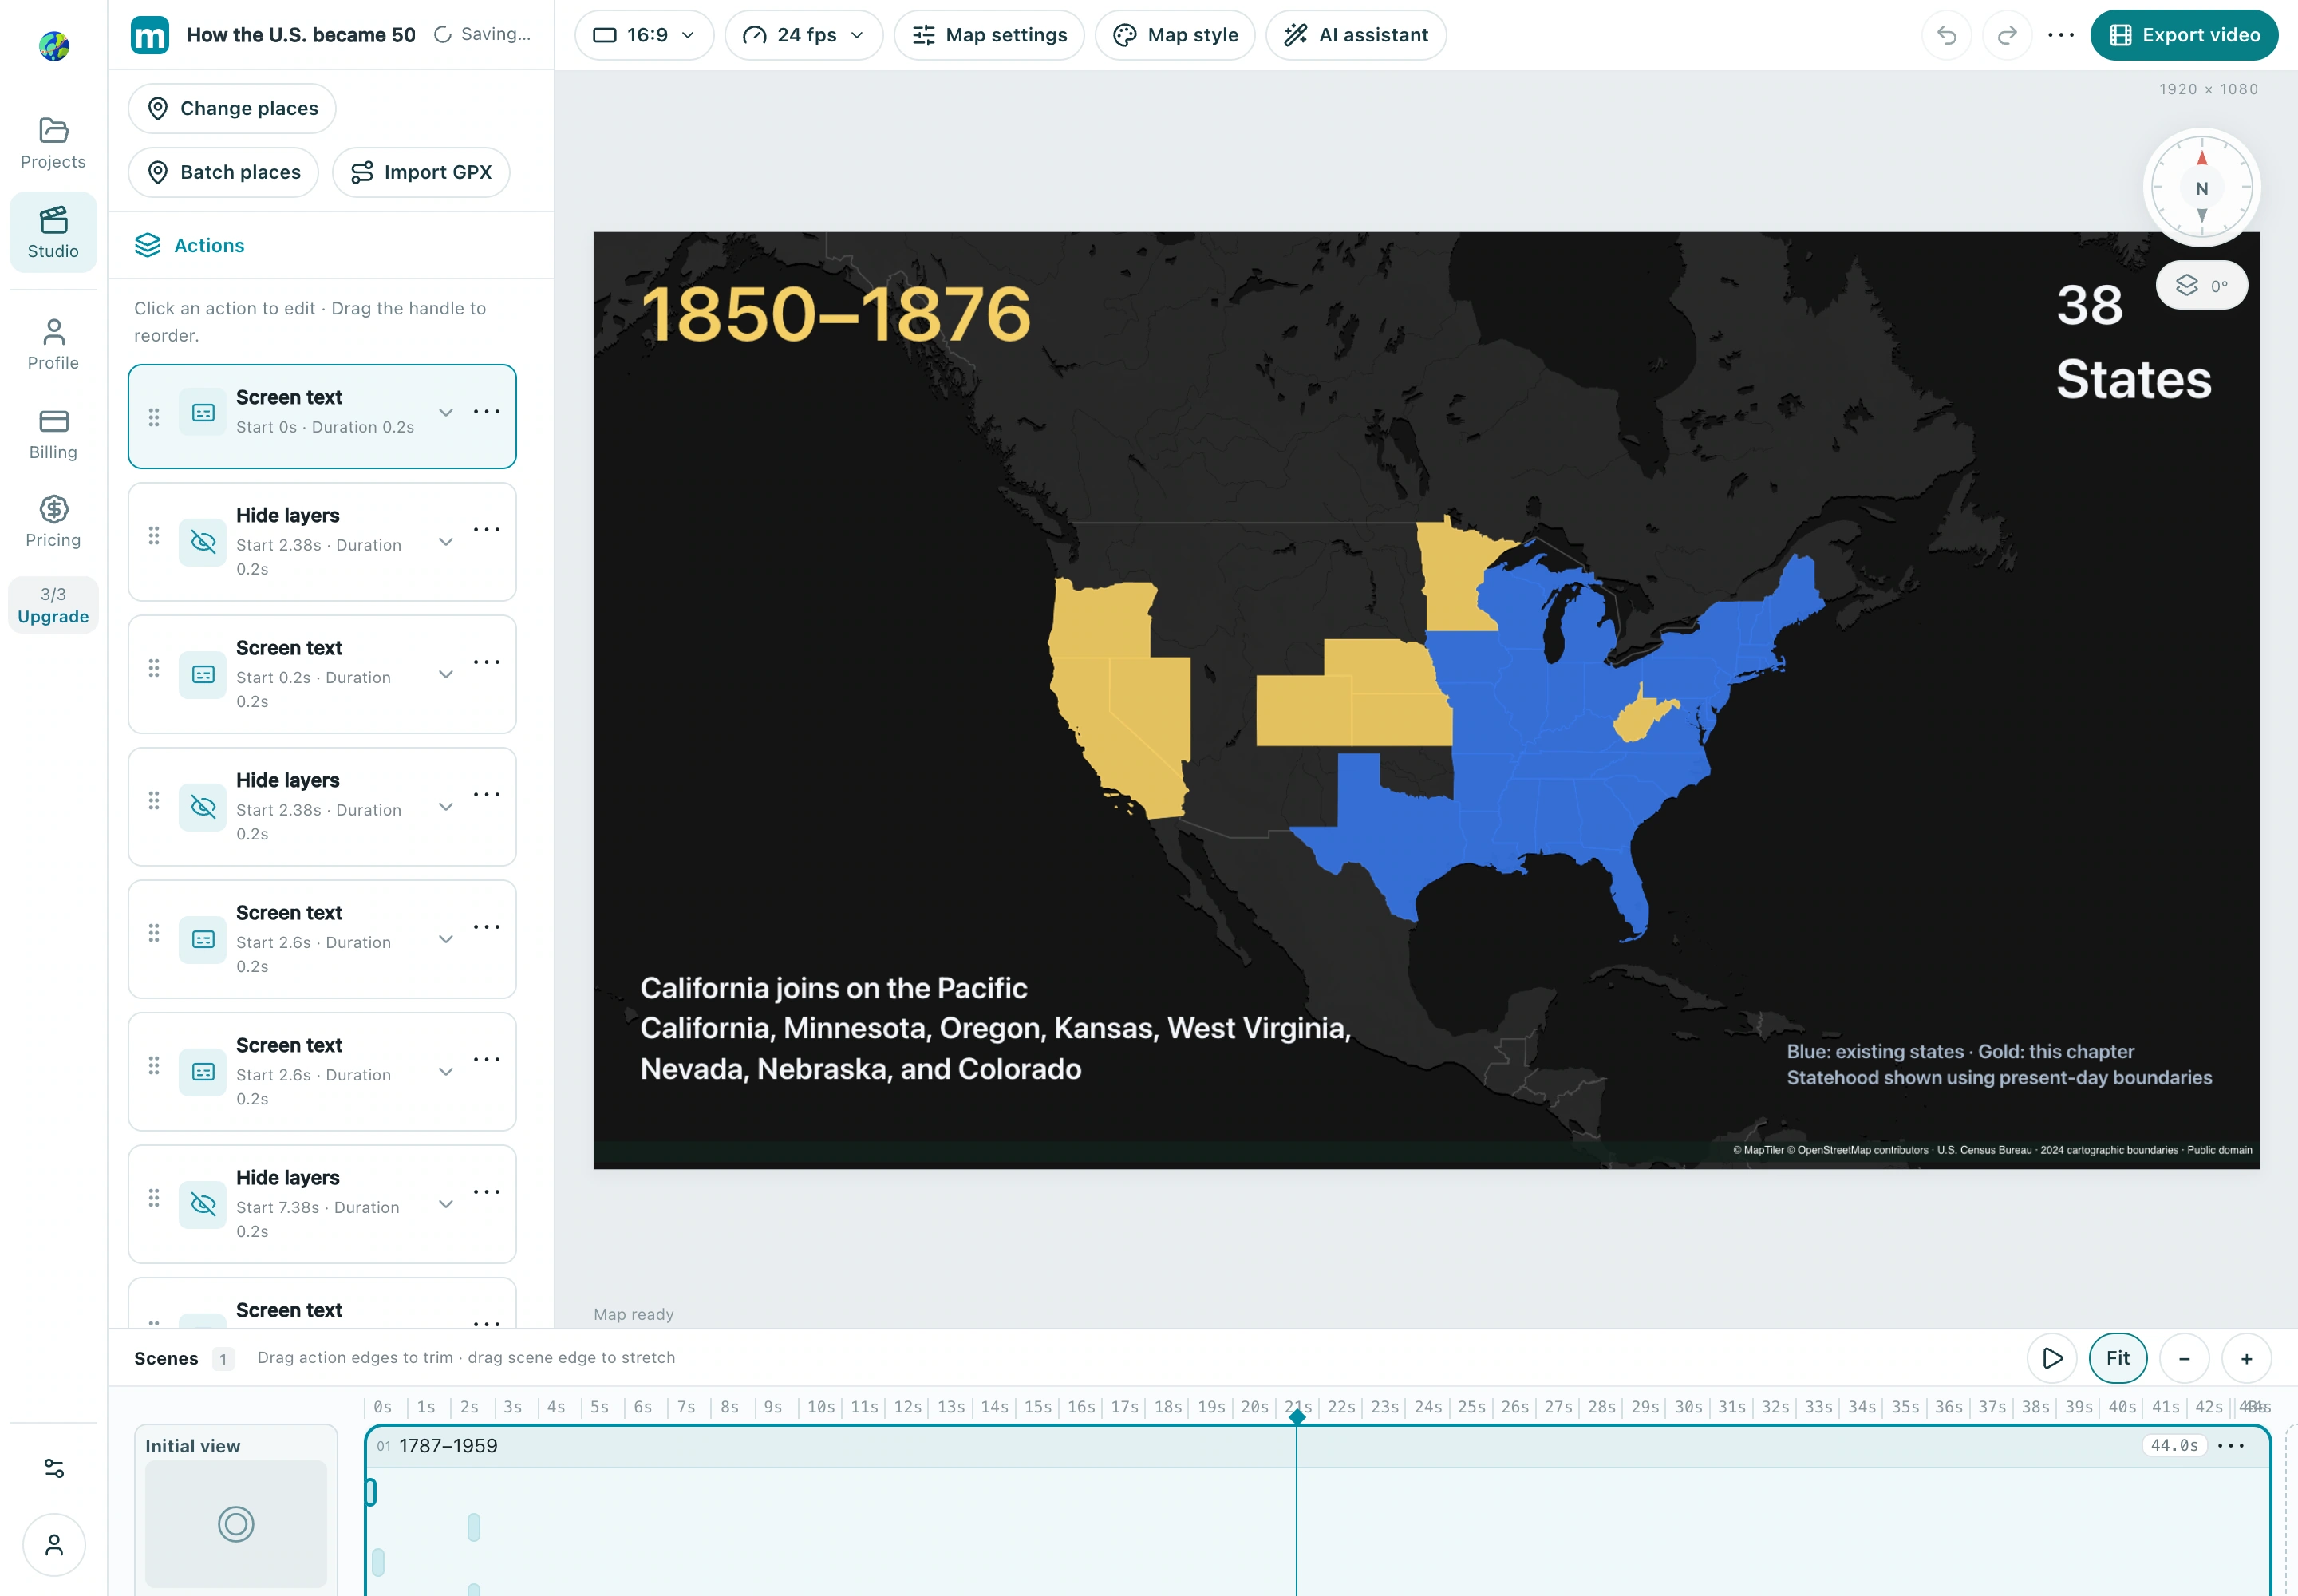
Use the dark data visualization basemap, hide base labels, and start with a north-up view centered at 96.5° W, 39.6° N (zoom 3.45, tilt 0°). Set a single scene to 44 seconds. Place the title from 0–2.6 s, then introduce the original thirteen from 2.6–7.6 s, in ratification order. Use one Area highlight action for each outline. This opening holds the same camera across the continental chapters so viewers can compare the map directly.
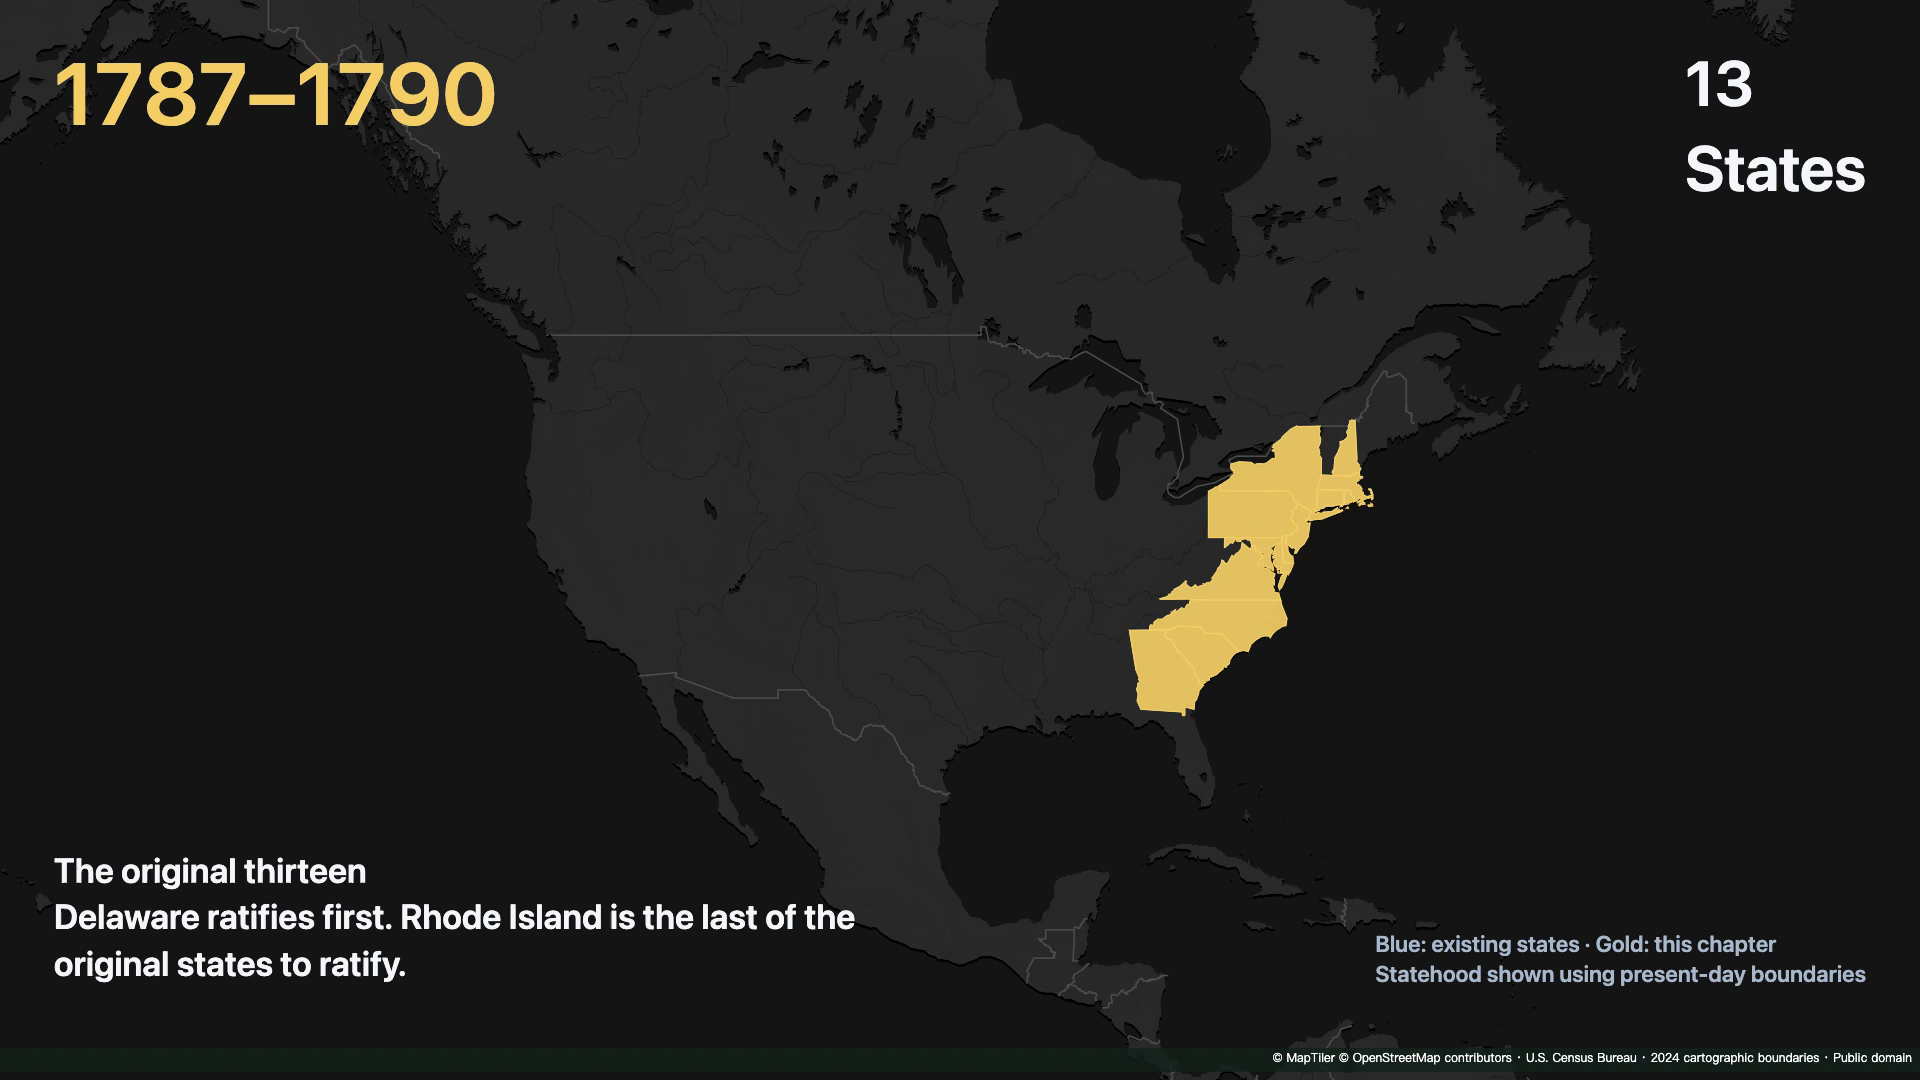
Check: At the end of the first chapter, the thirteen outlines are filled and the counter reads 13.
2. Set the chapter boundaries and replace the text
Put the period, state count and event description in separate Screen text actions. At each boundary, target the previous chapter’s text actions with Hide layers; in this film the exit starts 0.22 s before the boundary and lasts 0.20 s. Chapters begin at 7.6 s (1791–1812, 18 states), 11.8 s (1816–1821, 24), 15.9 s (1836–1848, 30), 20.1 s (1850–1876, 38), 24.8 s (1889–1890, 44) and 28.9 s (1896–1912, 48). Keep one persistent legend at the bottom right.
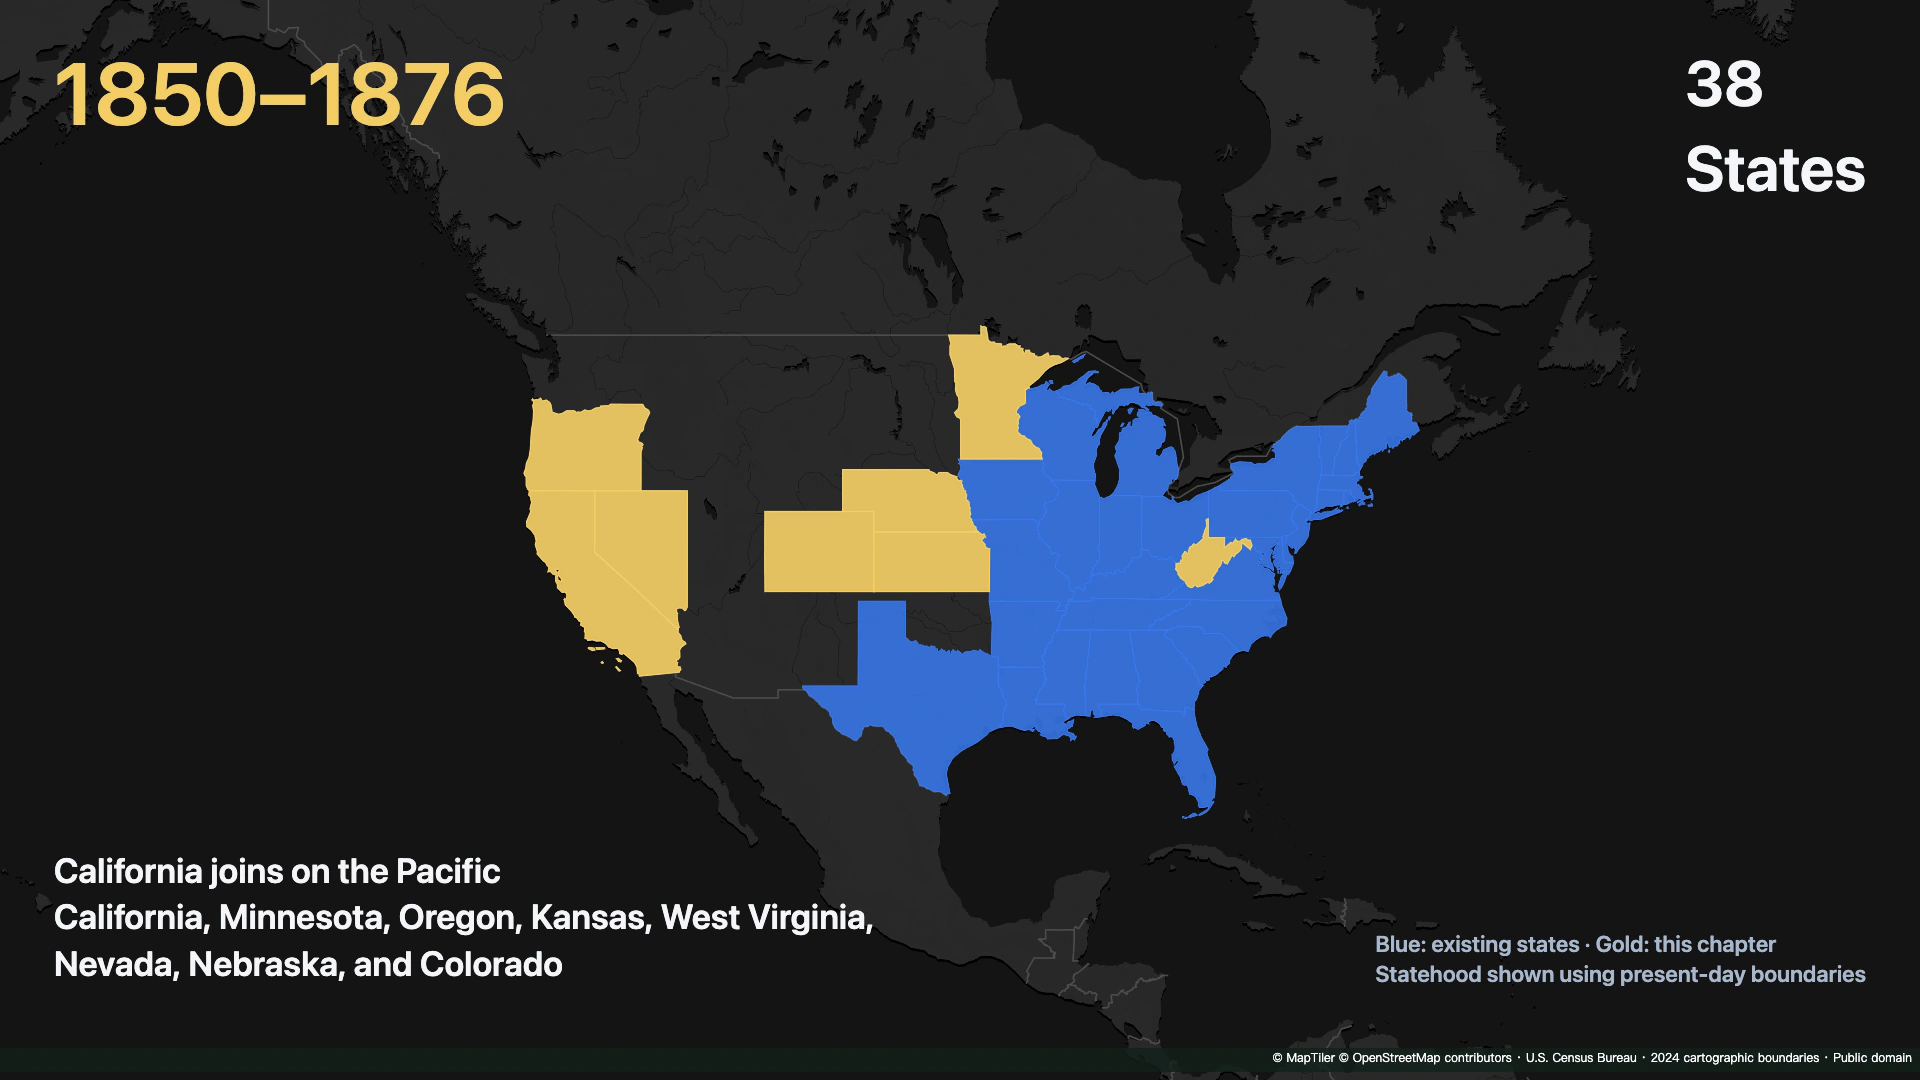
Check: Scrub across 20.1 s. The previous labels disappear, the counter becomes 38, and California’s cohort enters.
3. Stagger the gold entrance, then keep the blue fill
Set the first new state’s gold Area highlight (#F4CE65) to start 0.12 s into the chapter and last 0.40 s. Add 0.055 s to each following start. At chapter start +1.95 s, add a blue Area highlight (#3878ED) for each new state and use Hide layers to fade out that state’s gold fill and border over 0.45 s. Leave the blue actions visible for the rest of the film. In the 1850–1876 chapter, California’s gold action starts at 20.22 s and its blue action starts at 22.05 s.
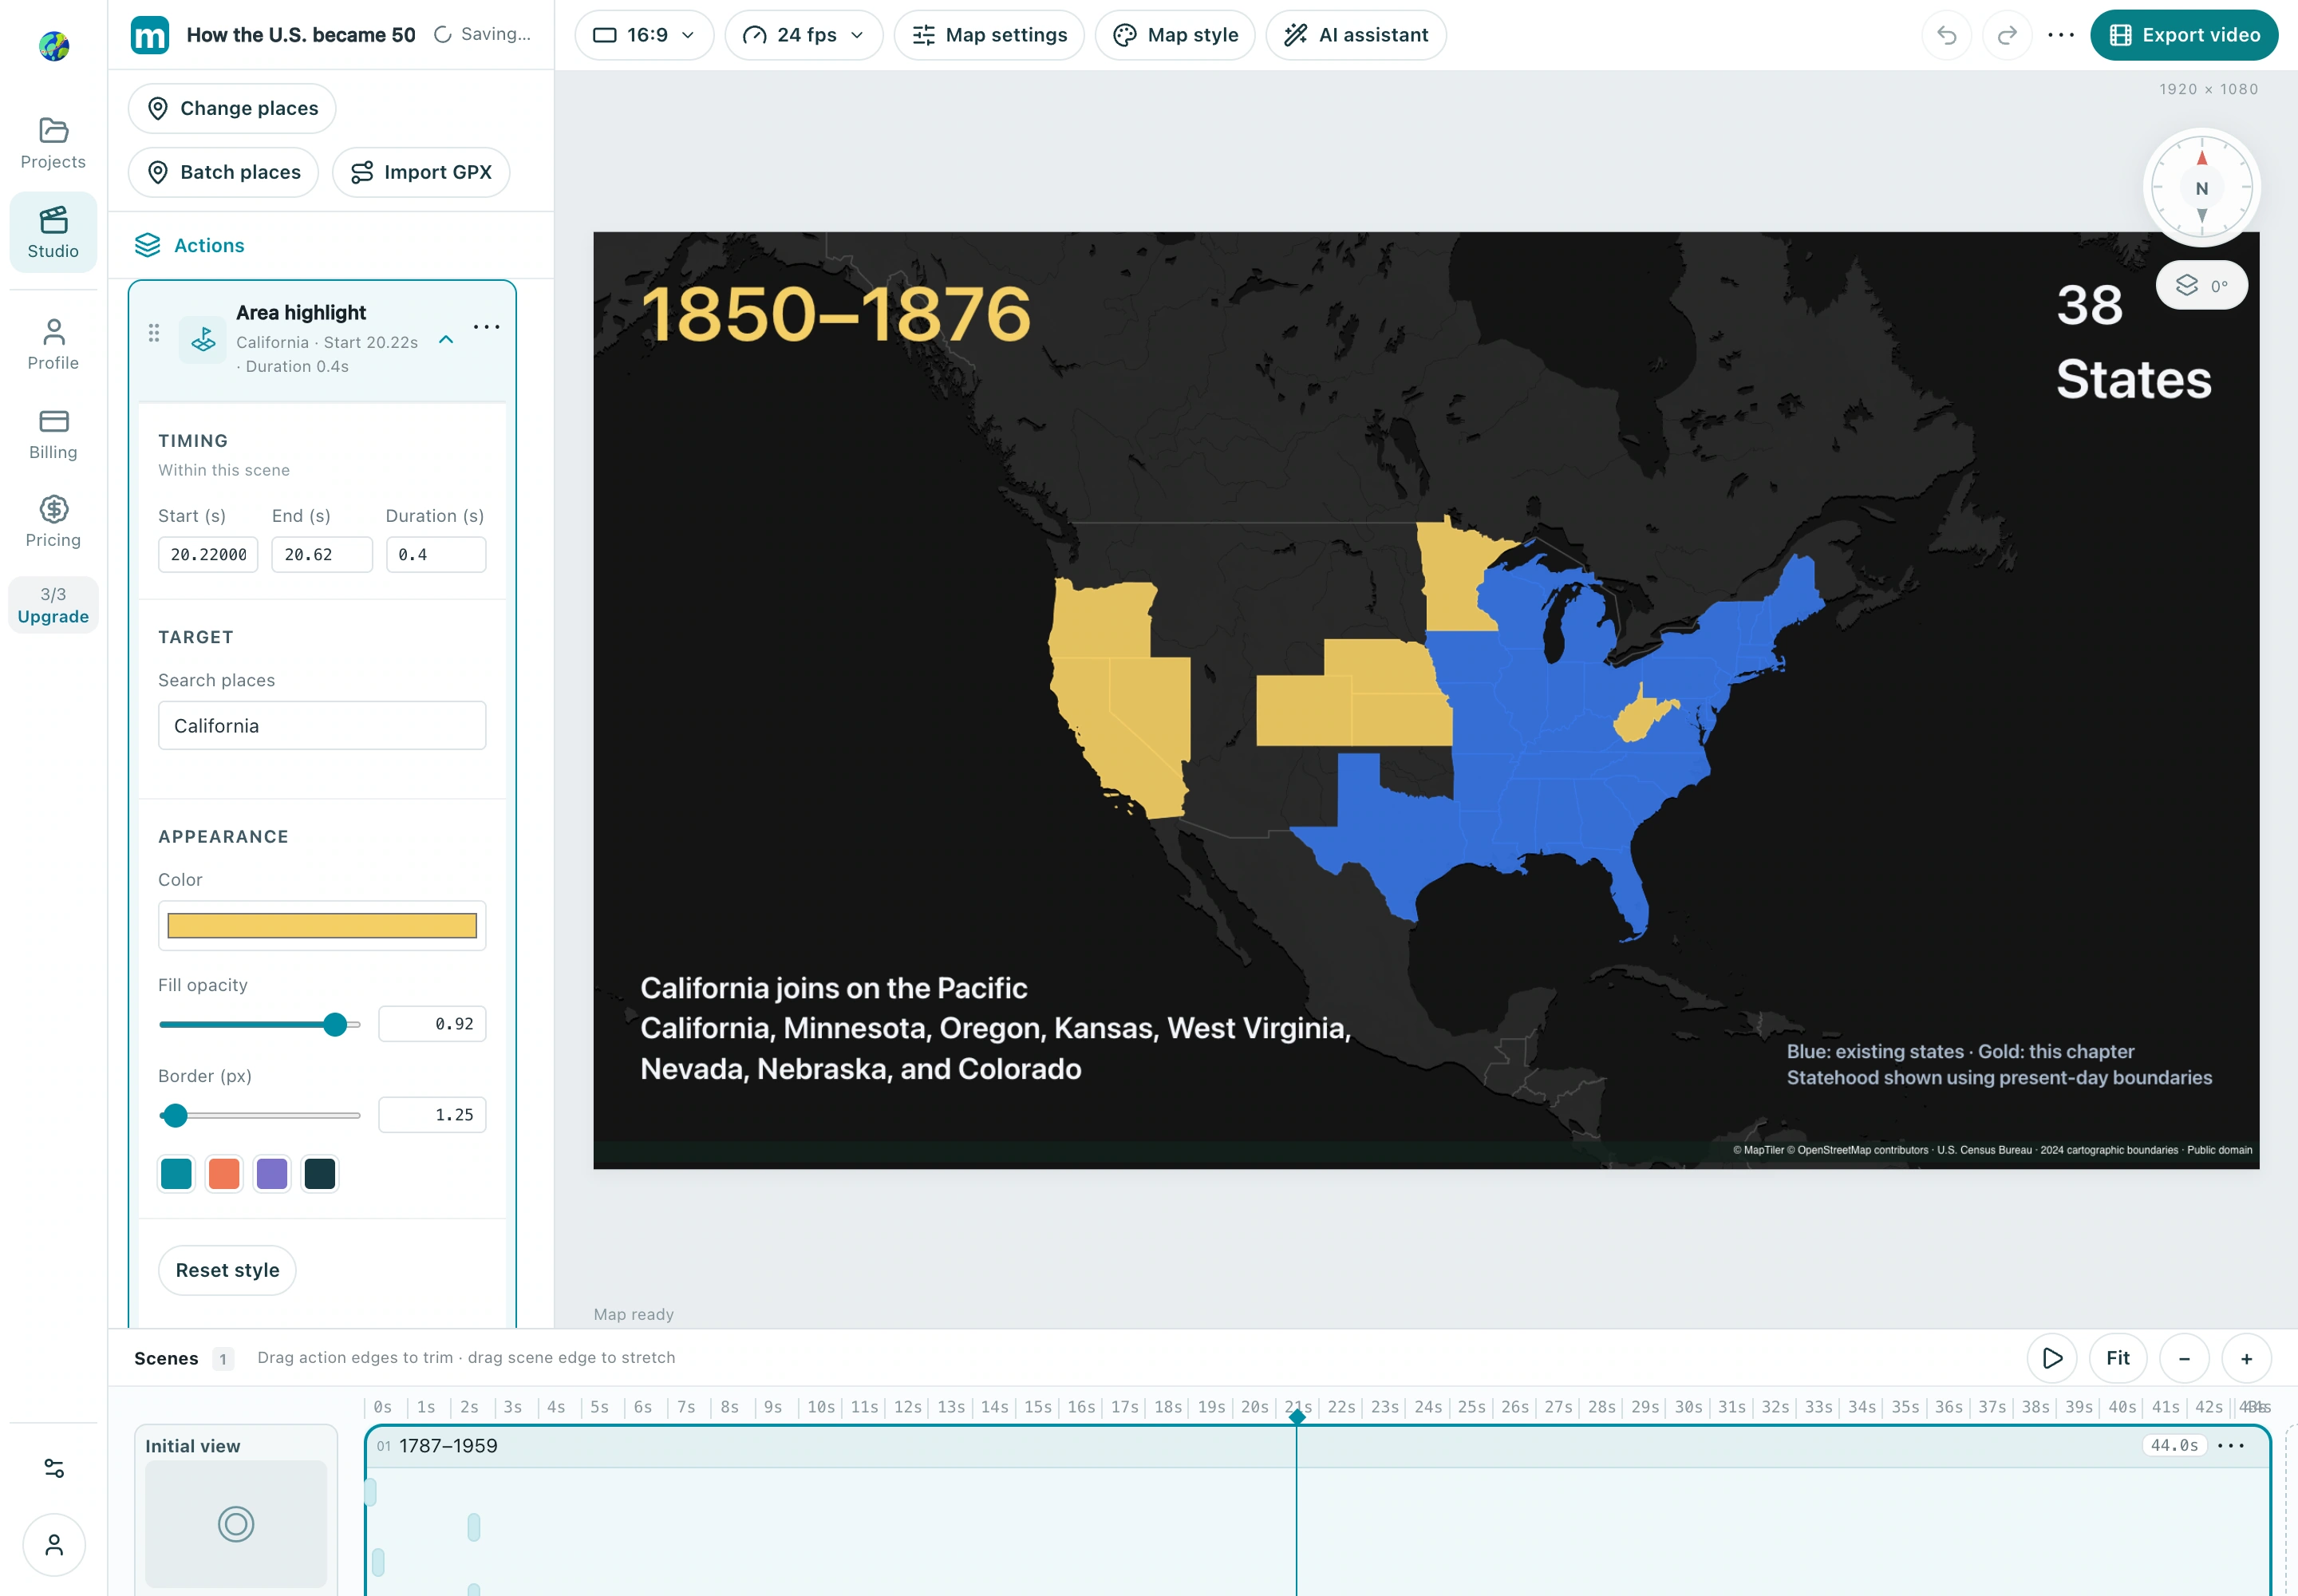
Check: After the transition, the newly admitted states are blue and the earlier states remain visible.
4. Move to Alaska, Hawaii and the final overview
At 33.0 s, add a 0.80 s camera move to Alaska (151° W, 63° N, zoom 3.65) and show state 49. At 37.4 s, move to Hawaii (157.4° W, 20.85° N, zoom 6.25) and show state 50. For these two chapters, delay the gold entrance until +0.77 s and the transition to blue until +2.40 s. At 41.0 s, pull back to a view centered at 127° W, 49° N (zoom 2.52) to show all 50 states together. Preview the full 44 seconds and export a 1920 × 1080 MP4 at 24 fps.
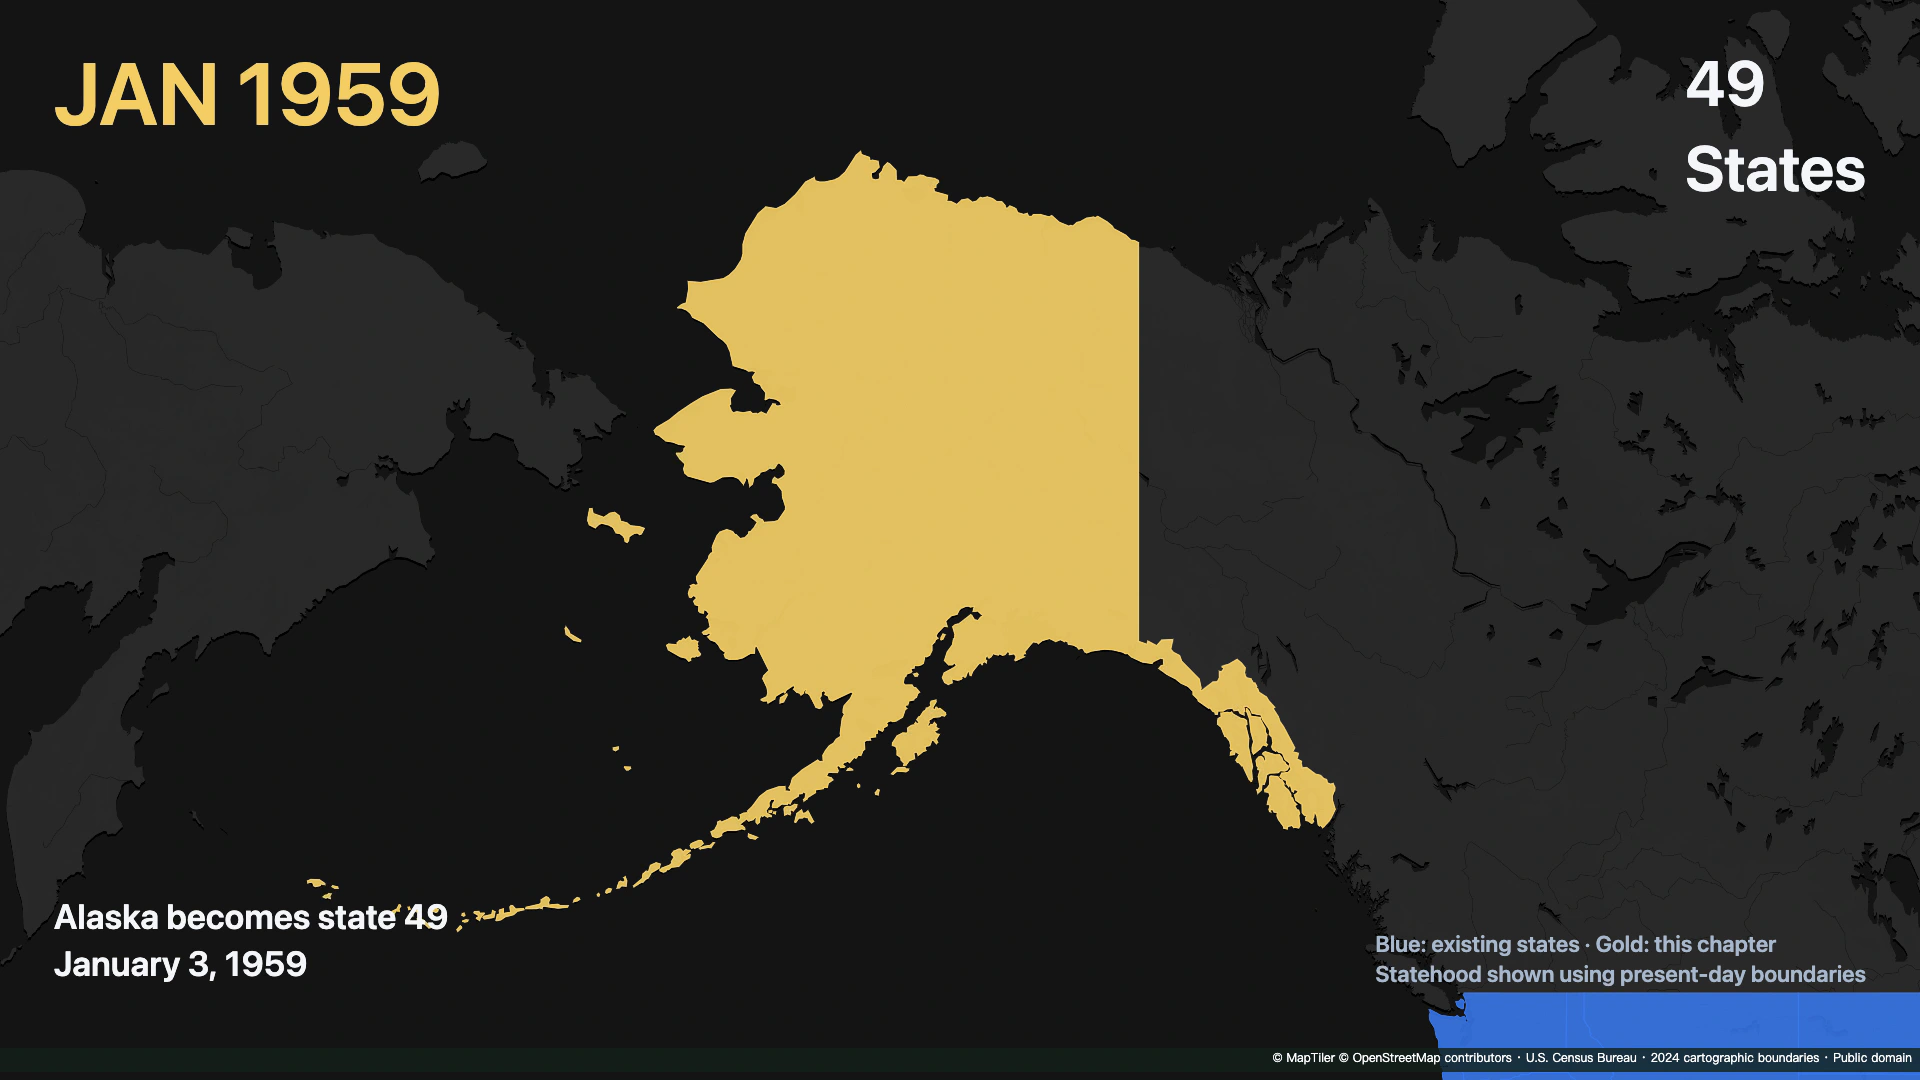
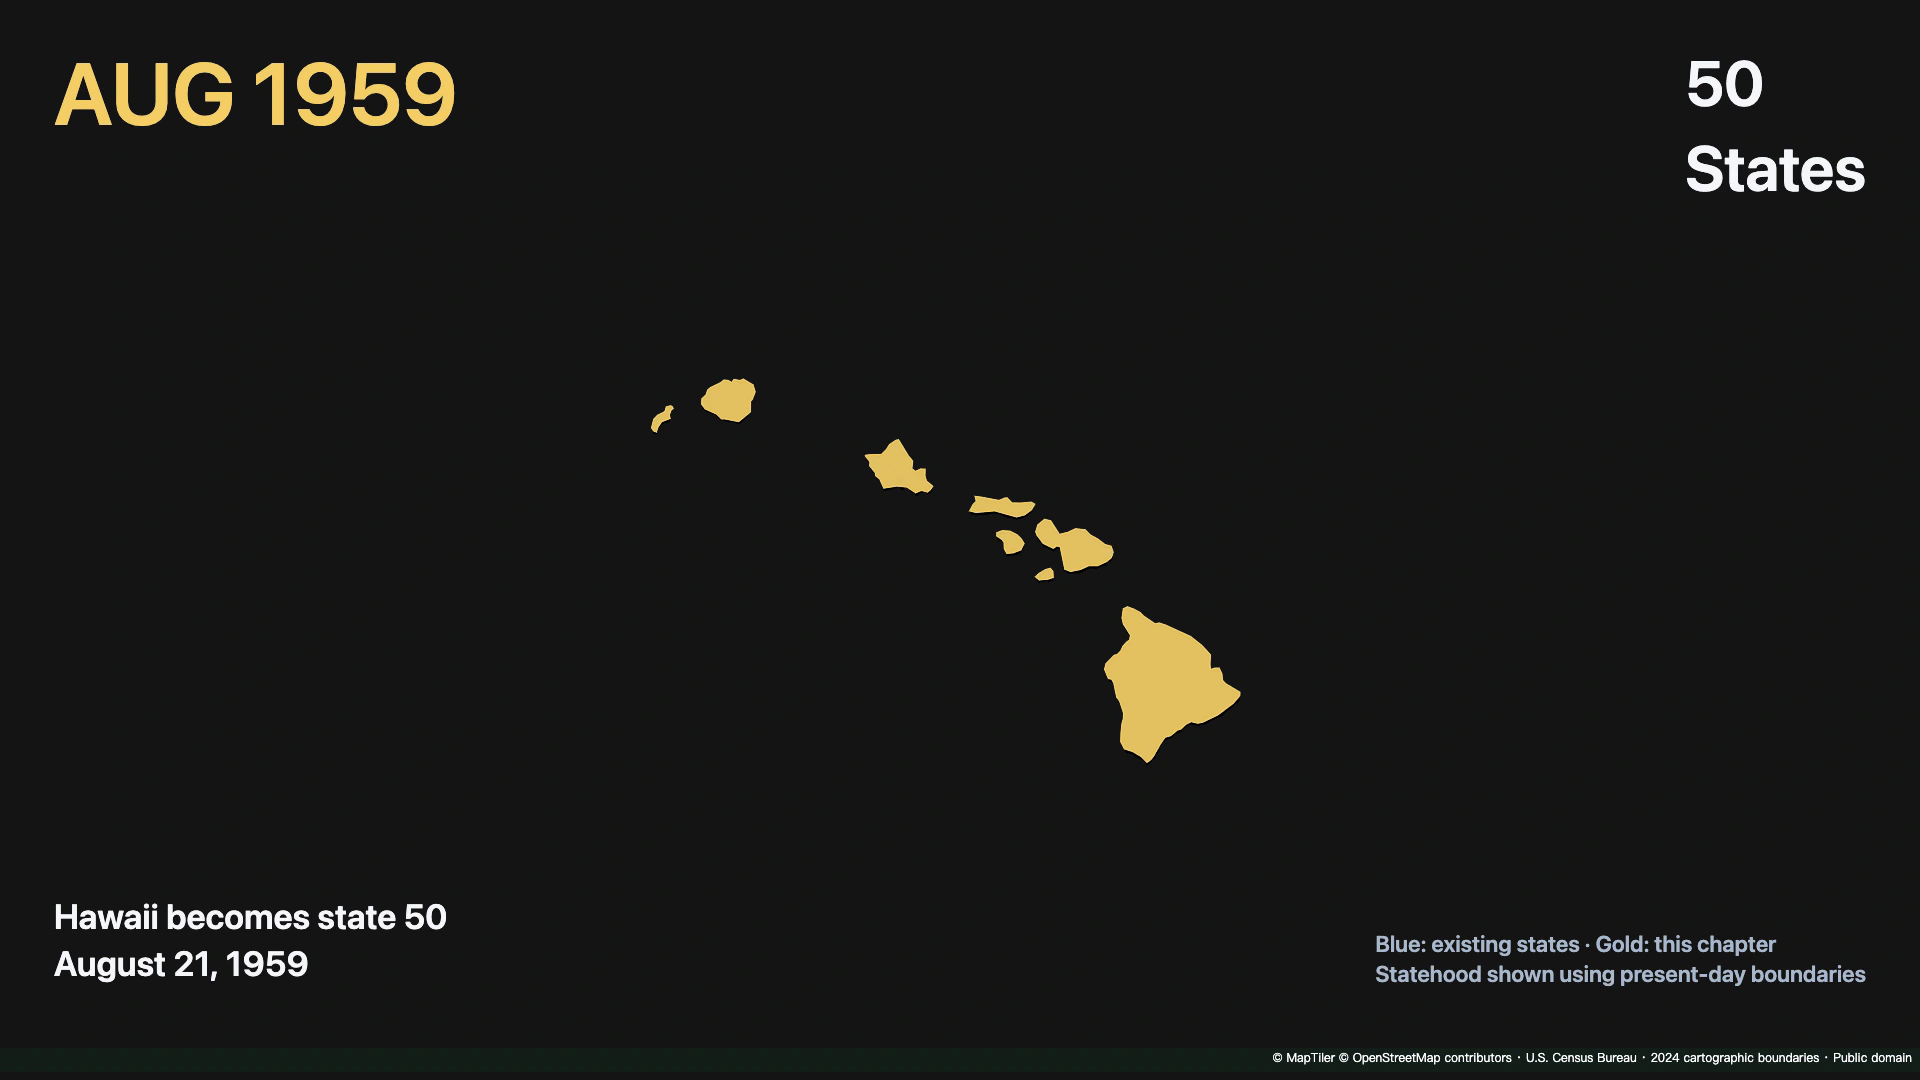
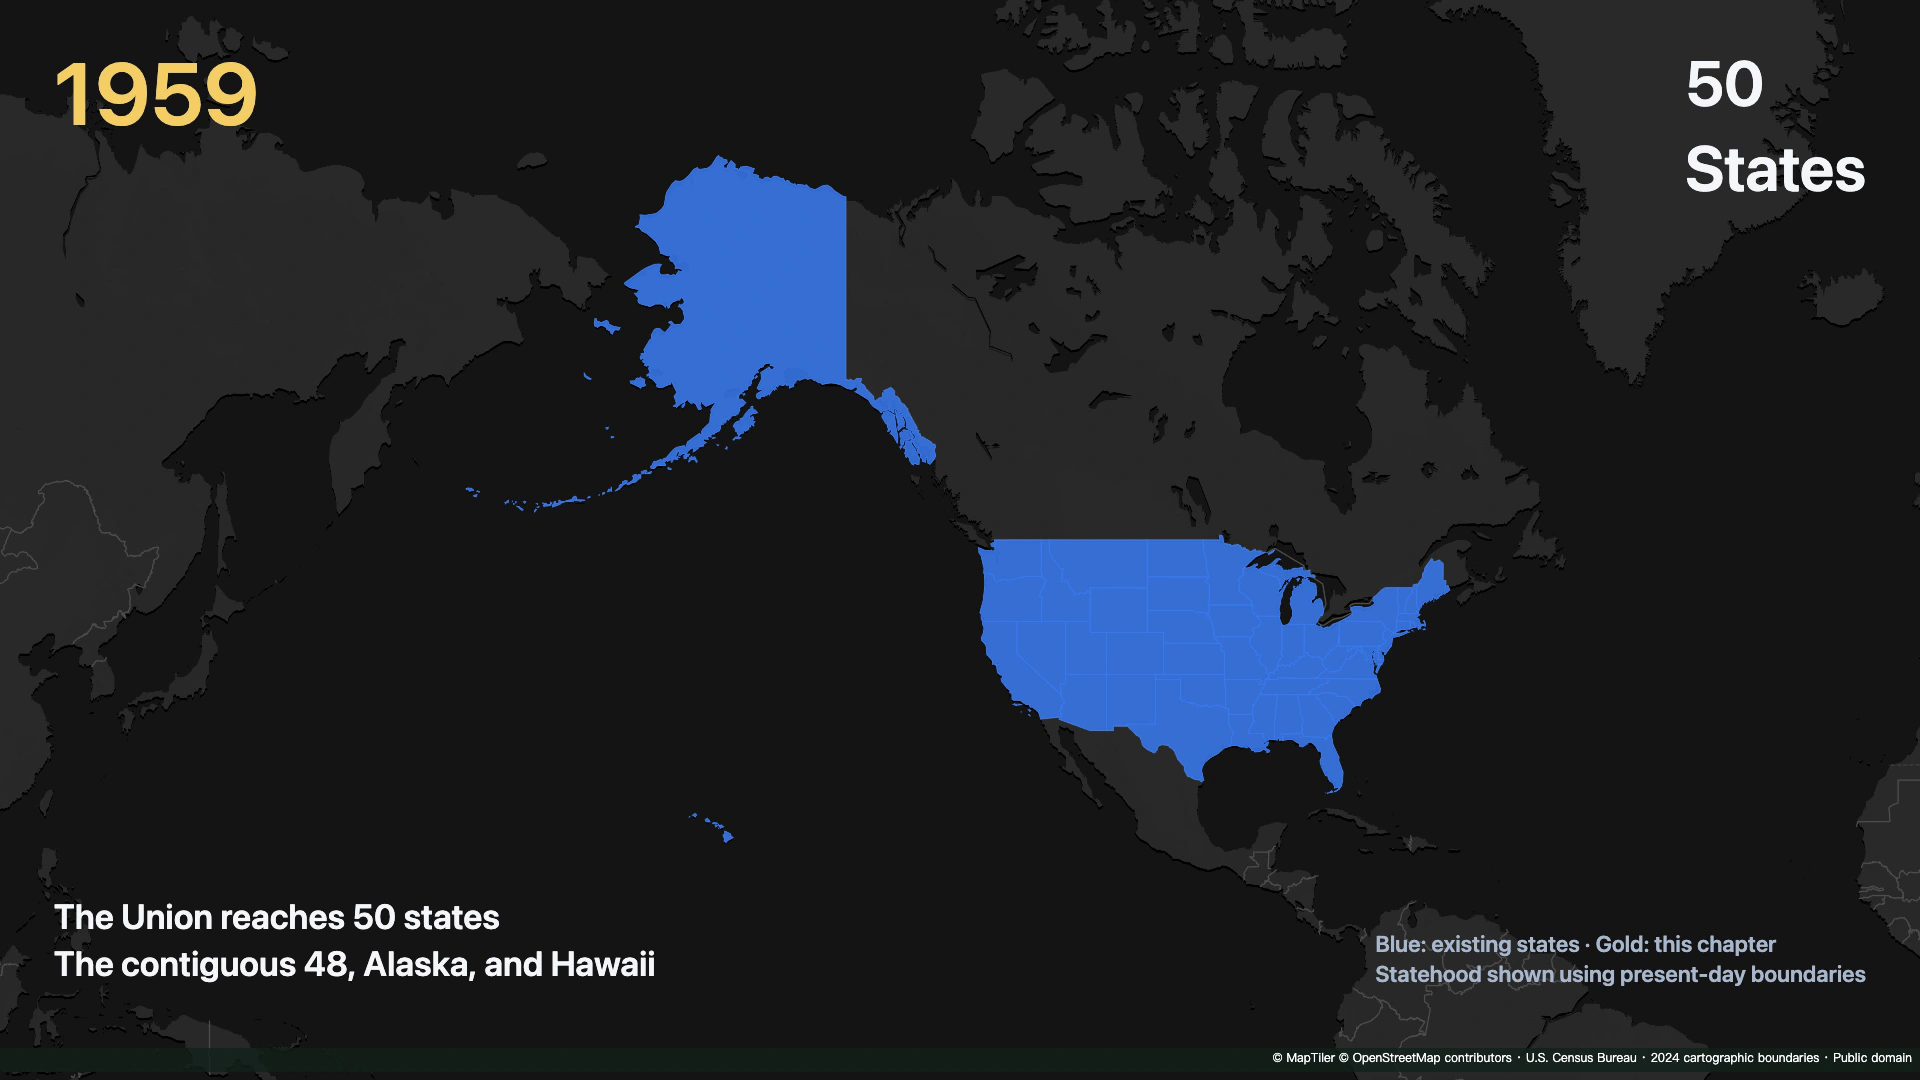
Check: The final view includes the contiguous states, Alaska and Hawaii, and the counter remains at 50.
Make your own version
Replace the example with a city you know, finish a short sequence, and review it end to end. Make one clear story before adding more effects.
Practice in Studio