
How to animate 50 years of global GDP on a map
Compare 1976–2025 in 15 seconds with proportional circles, synchronized years and one fixed world view.
Where the data came from
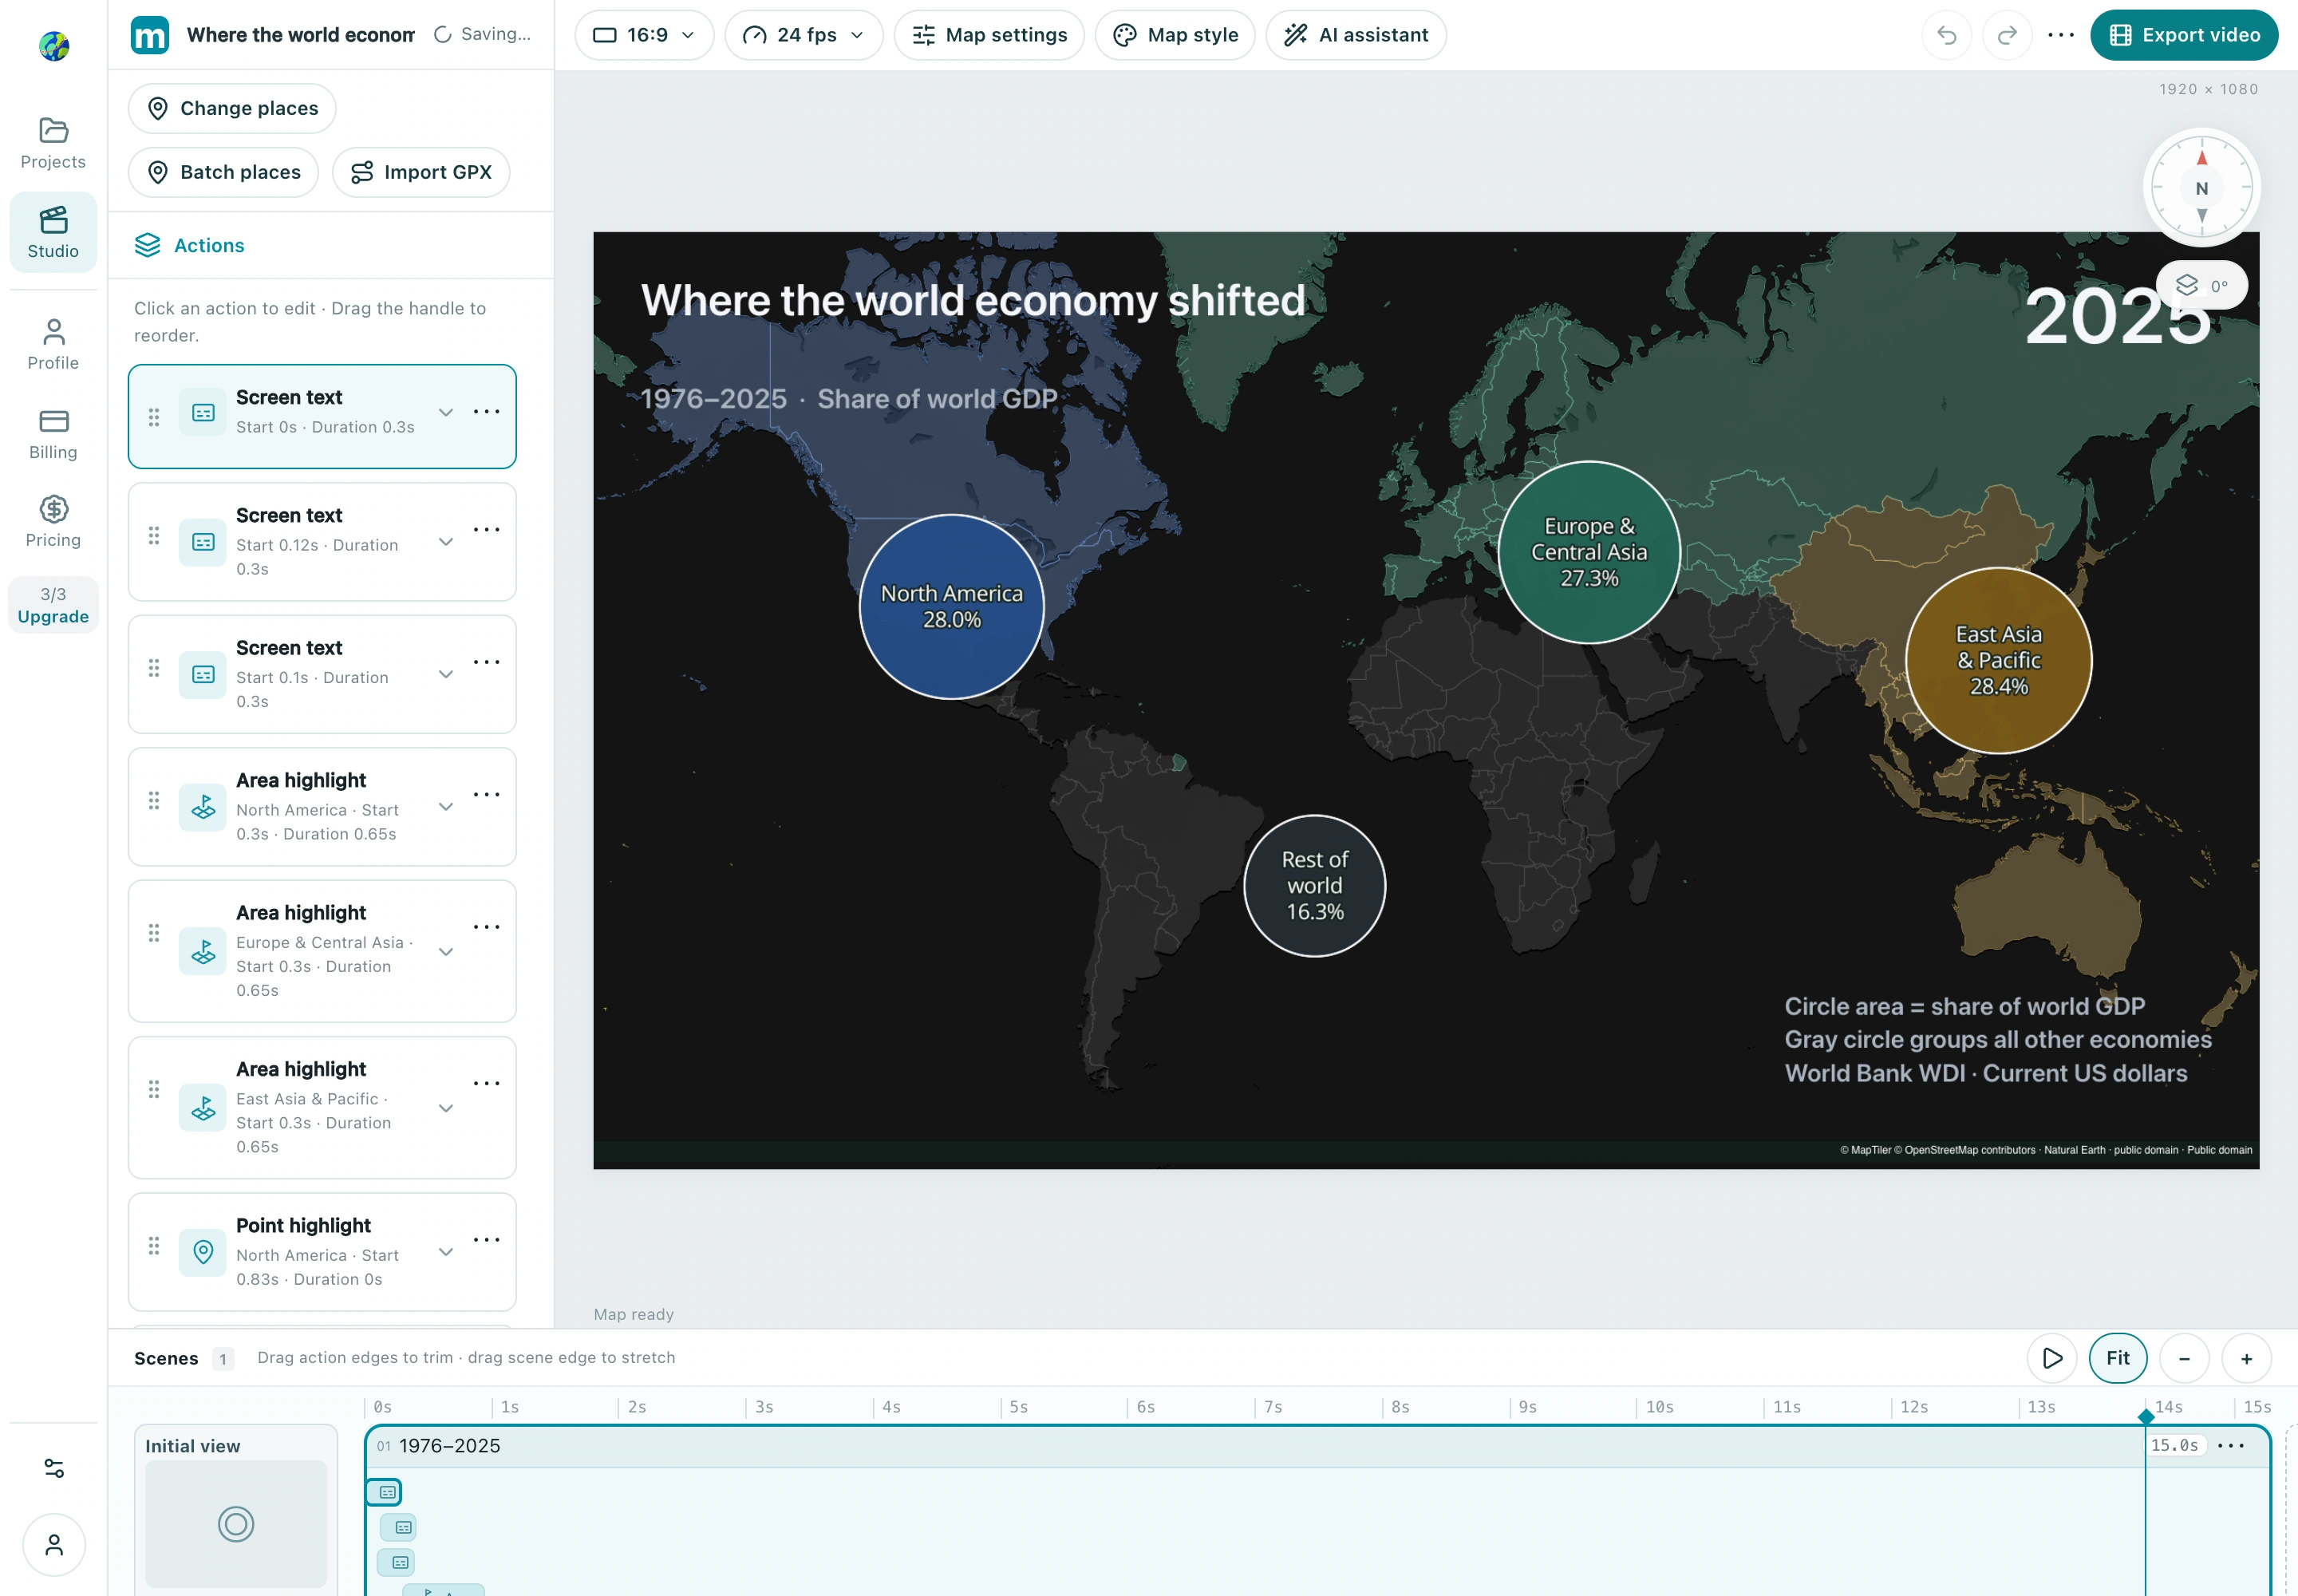
Use World Bank WDI indicator NY.GDP.MKTP.CD for the world, North America, Europe & Central Asia, and East Asia & Pacific. This is nominal GDP in current US dollars, so prices and exchange rates affect the result. Natural Earth 1:50m country outlines identify the regions using the World Bank’s present-day grouping.
Open the English GDP example from the homepage gallery and start from its template. This film was assembled as a native Studio project and exported with Studio’s engine. The film and all screenshots are in English.
Watch the result
1. Calculate each region’s share
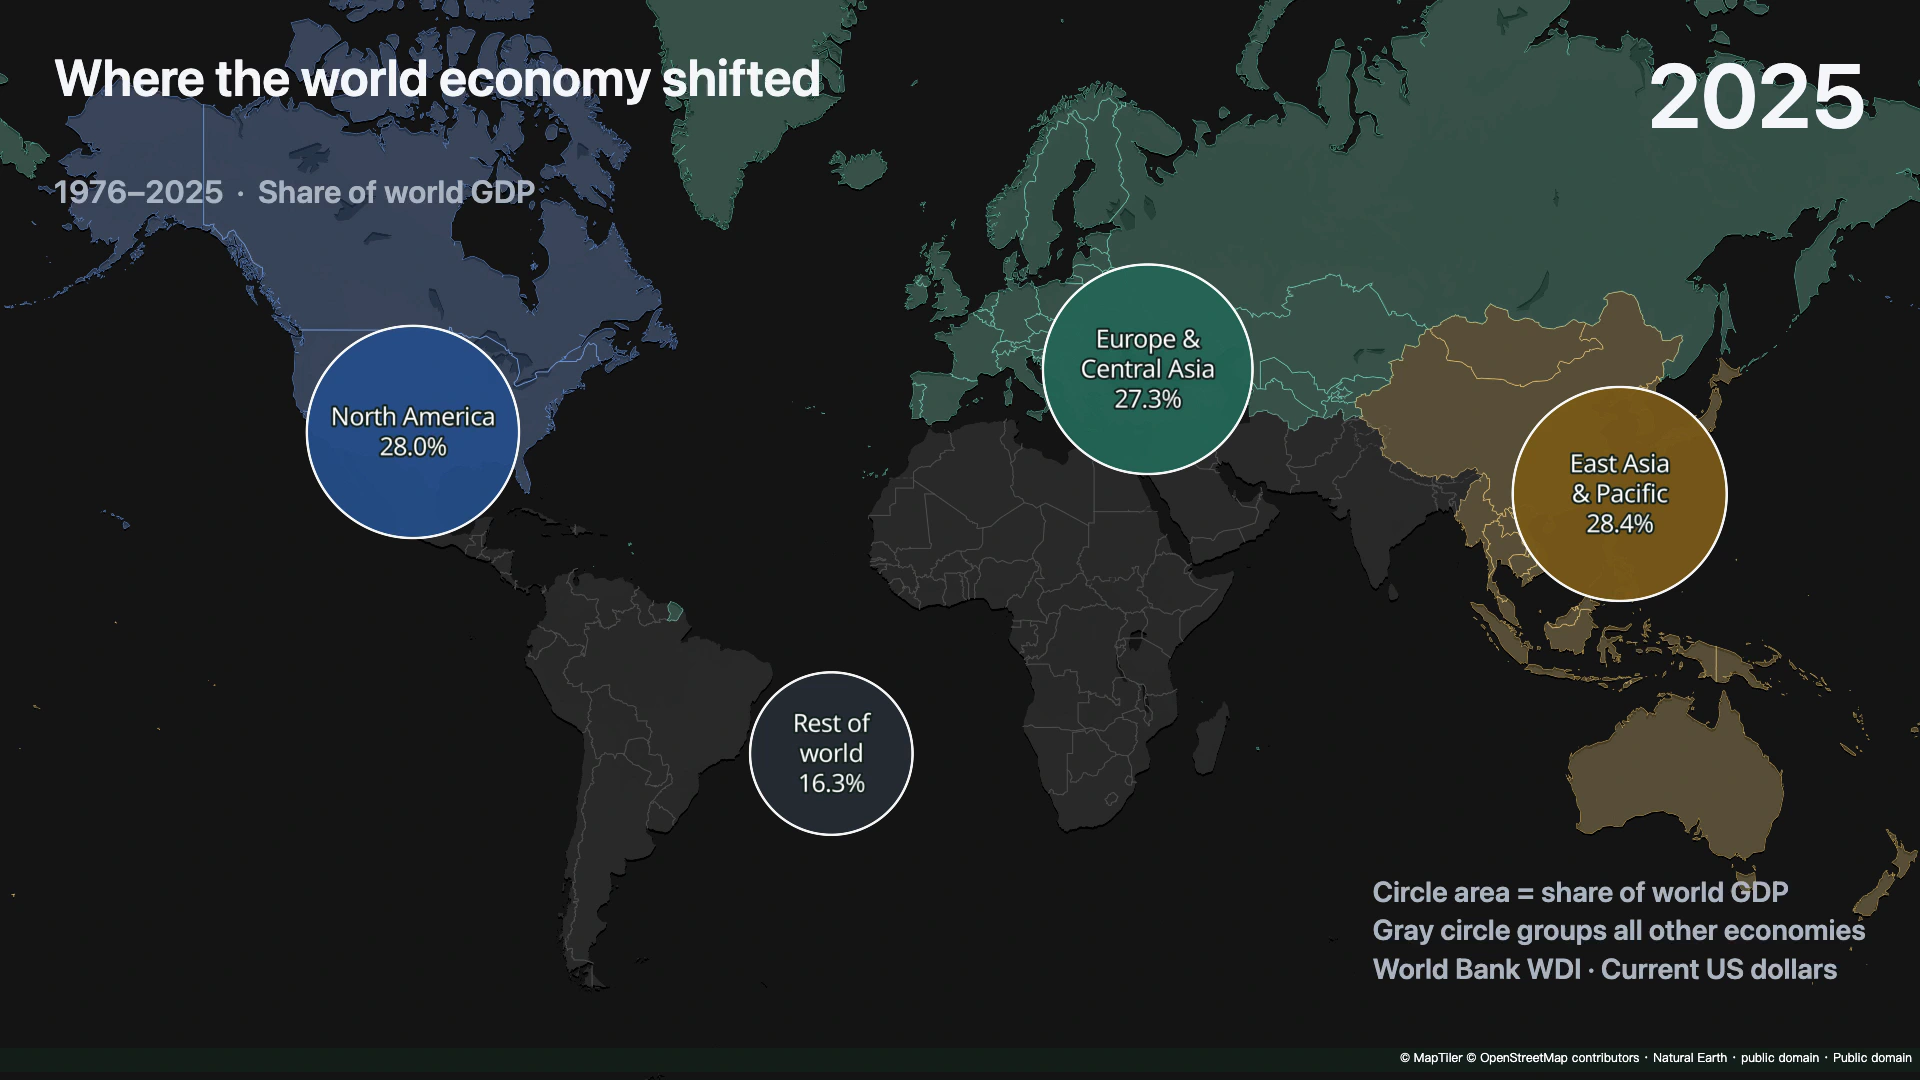
Divide each region’s GDP by the world total for the same year, then multiply by 100. Take Rest of world from the difference between the world total and the three regional totals, before rounding. Check that all four shares sum to 100% before rounding, and reject missing or duplicated years. In 2025 the displayed shares are 28.0%, 27.3%, 28.4%, and 16.3%.
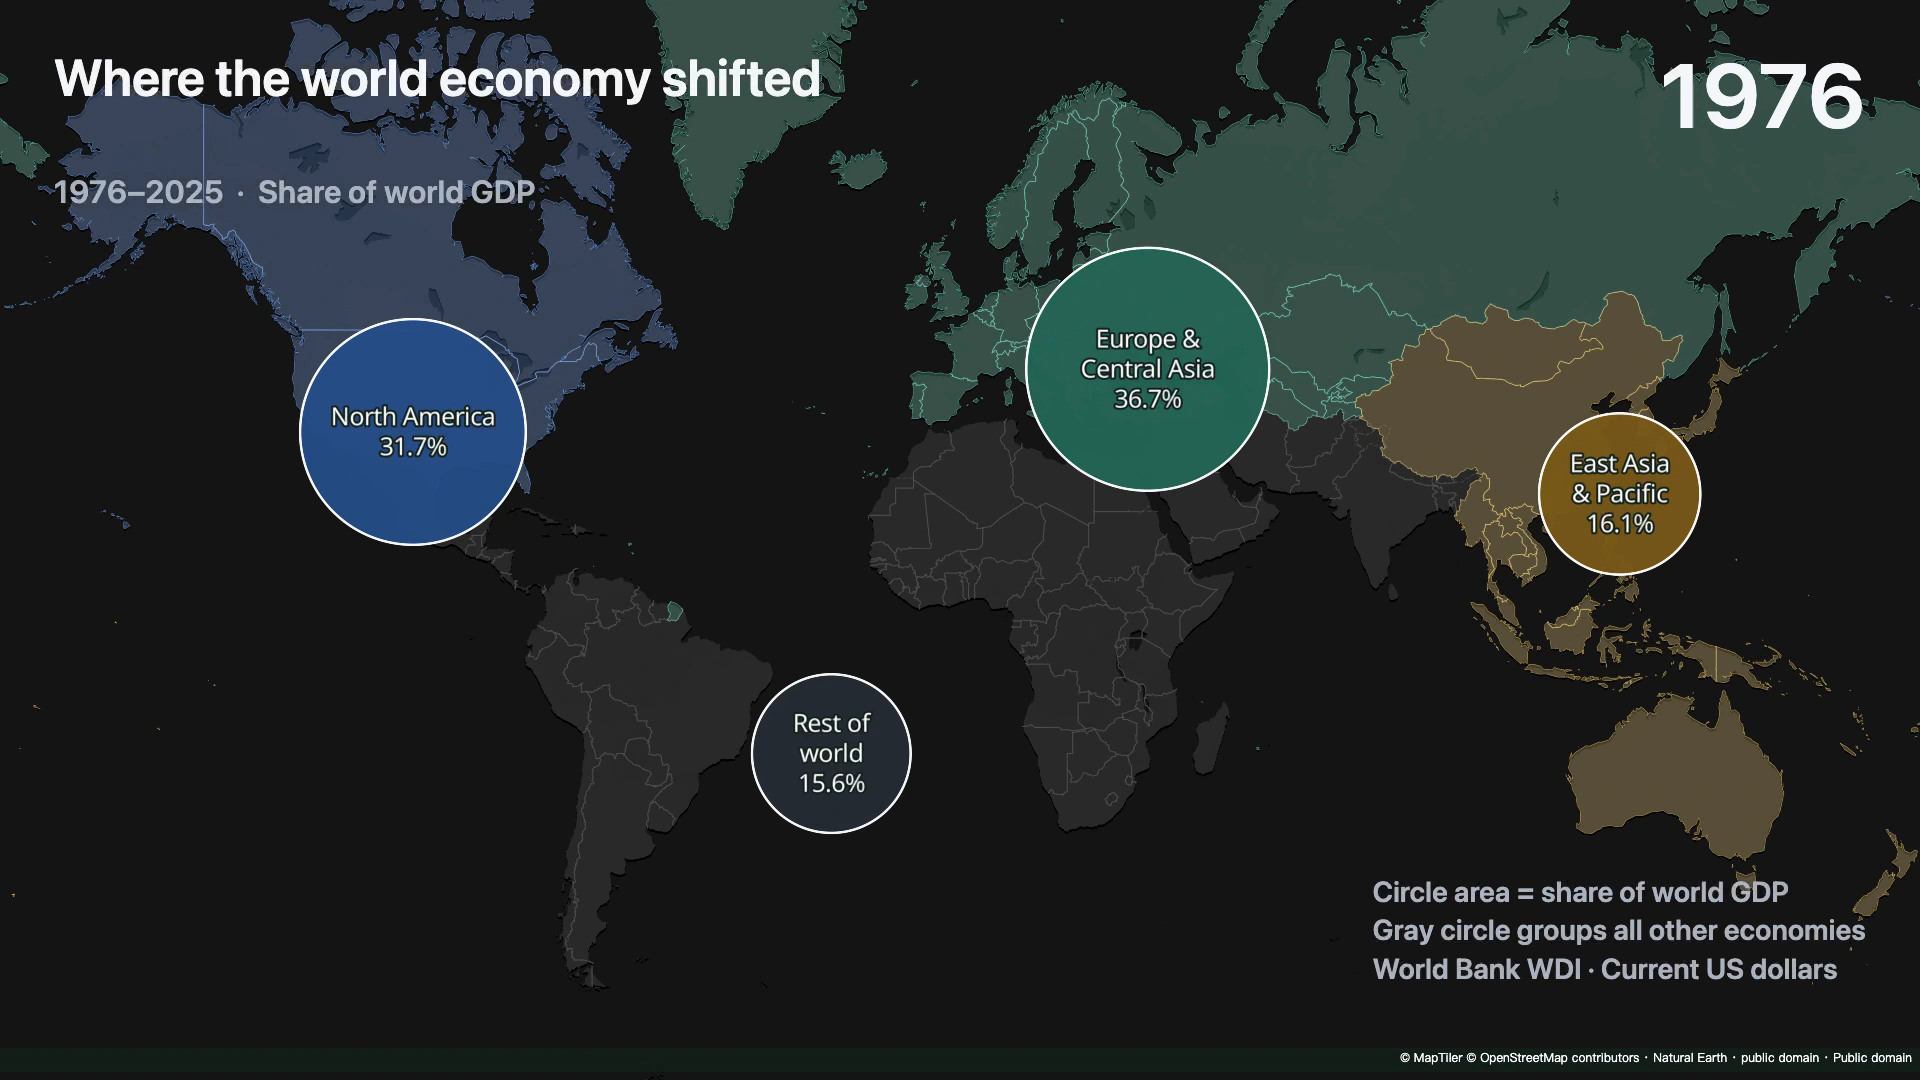
Check: Check the four shares and their matching year.
2. Set up the map and four markers
Use the dark basemap without place labels. Keep the view fixed at 0° E, 17° N and zoom 1.915. Add Area highlight for the three named regions, using blue, green, and gold to identify them. Place their markers at fixed illustrative locations. Put the gray Rest of world marker in the South Atlantic at 24° W, 22° S, leaving the other countries uncolored.
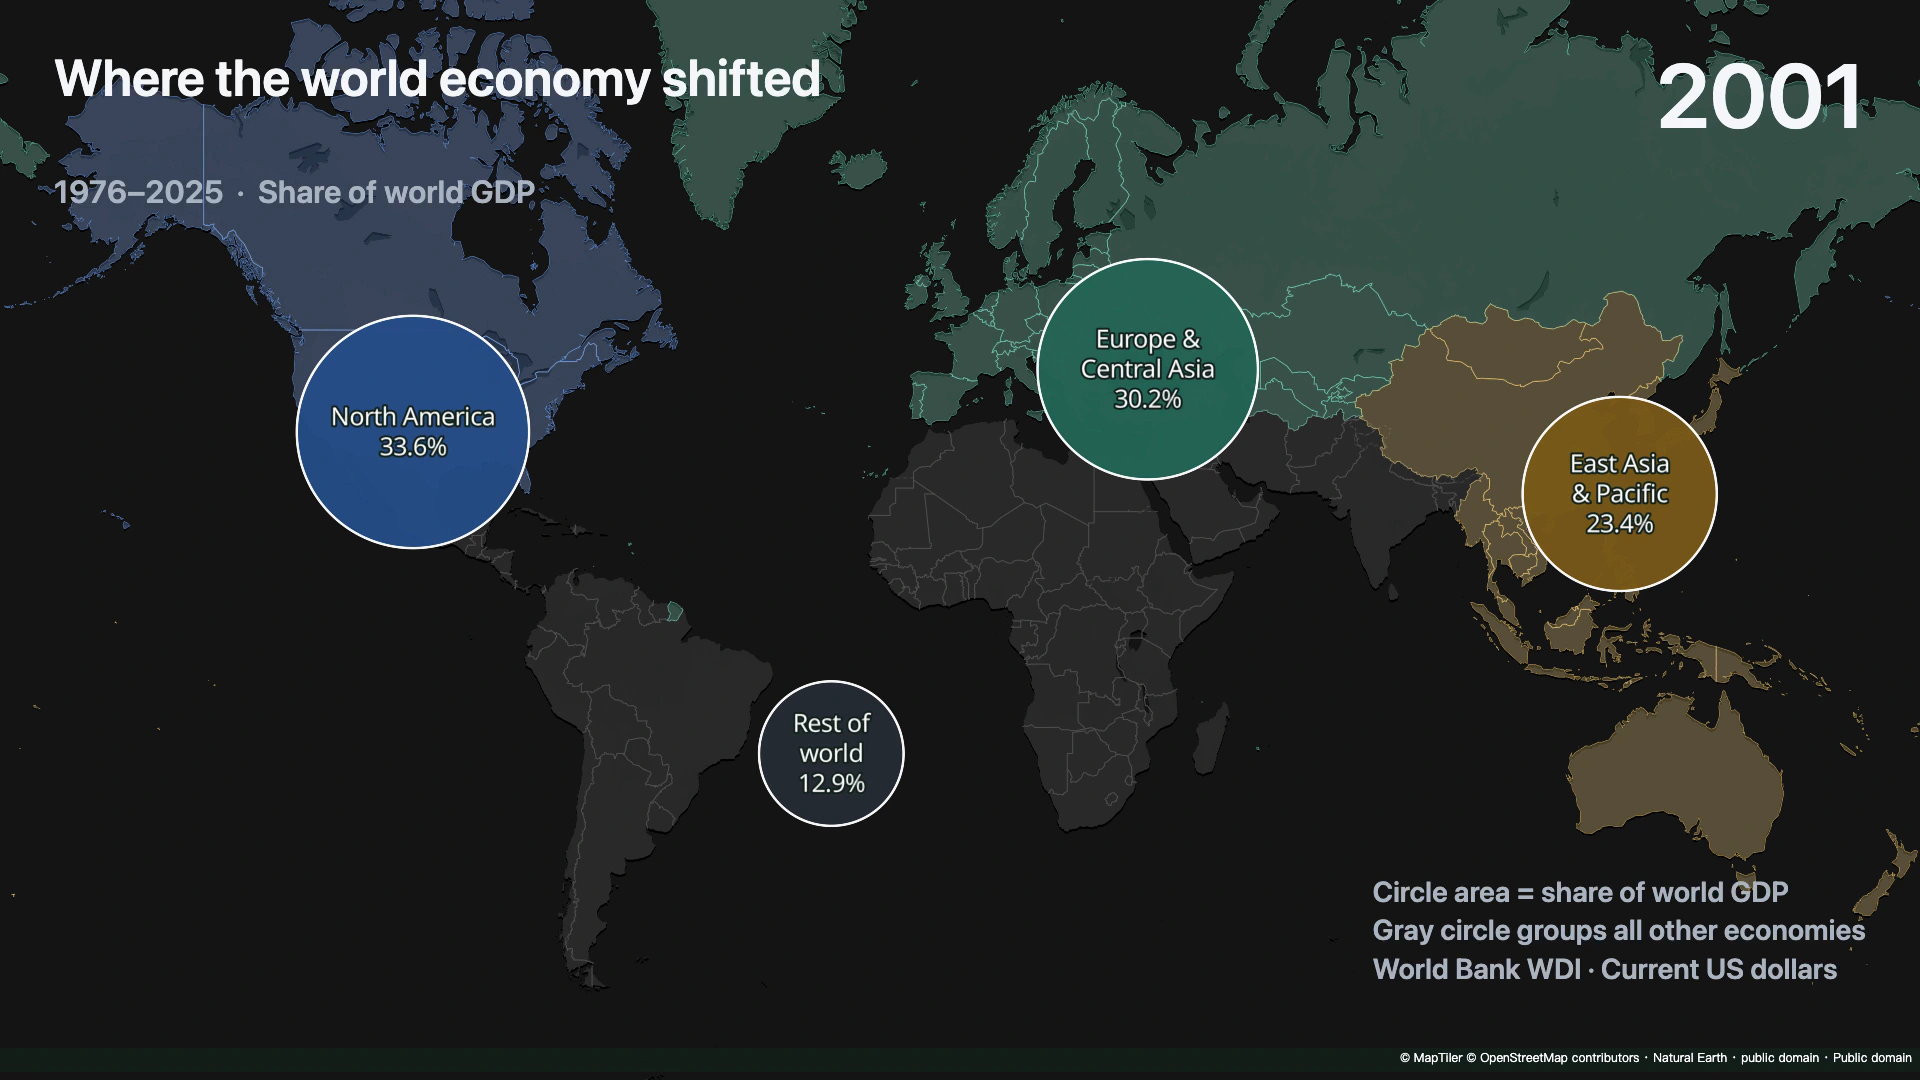
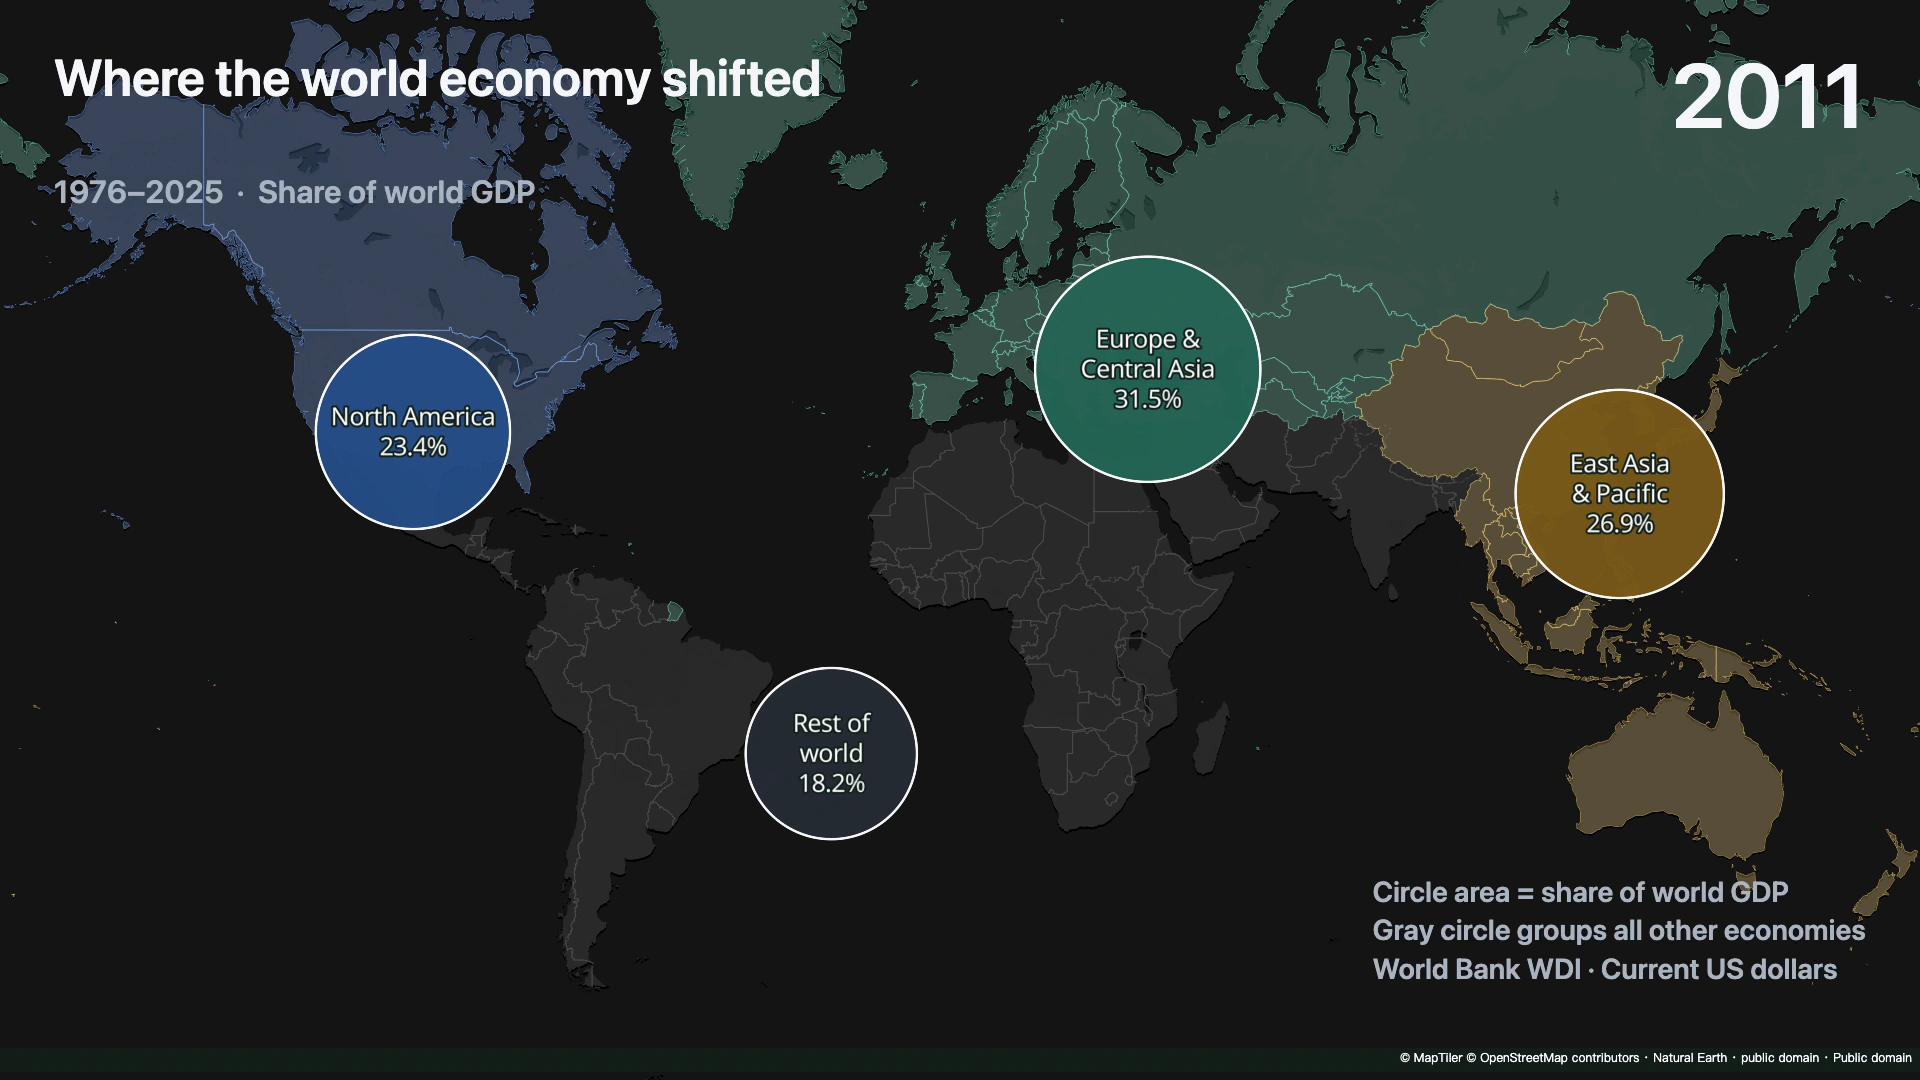
Check: Check the four shares and their matching year.
3. Use circle area to encode GDP share
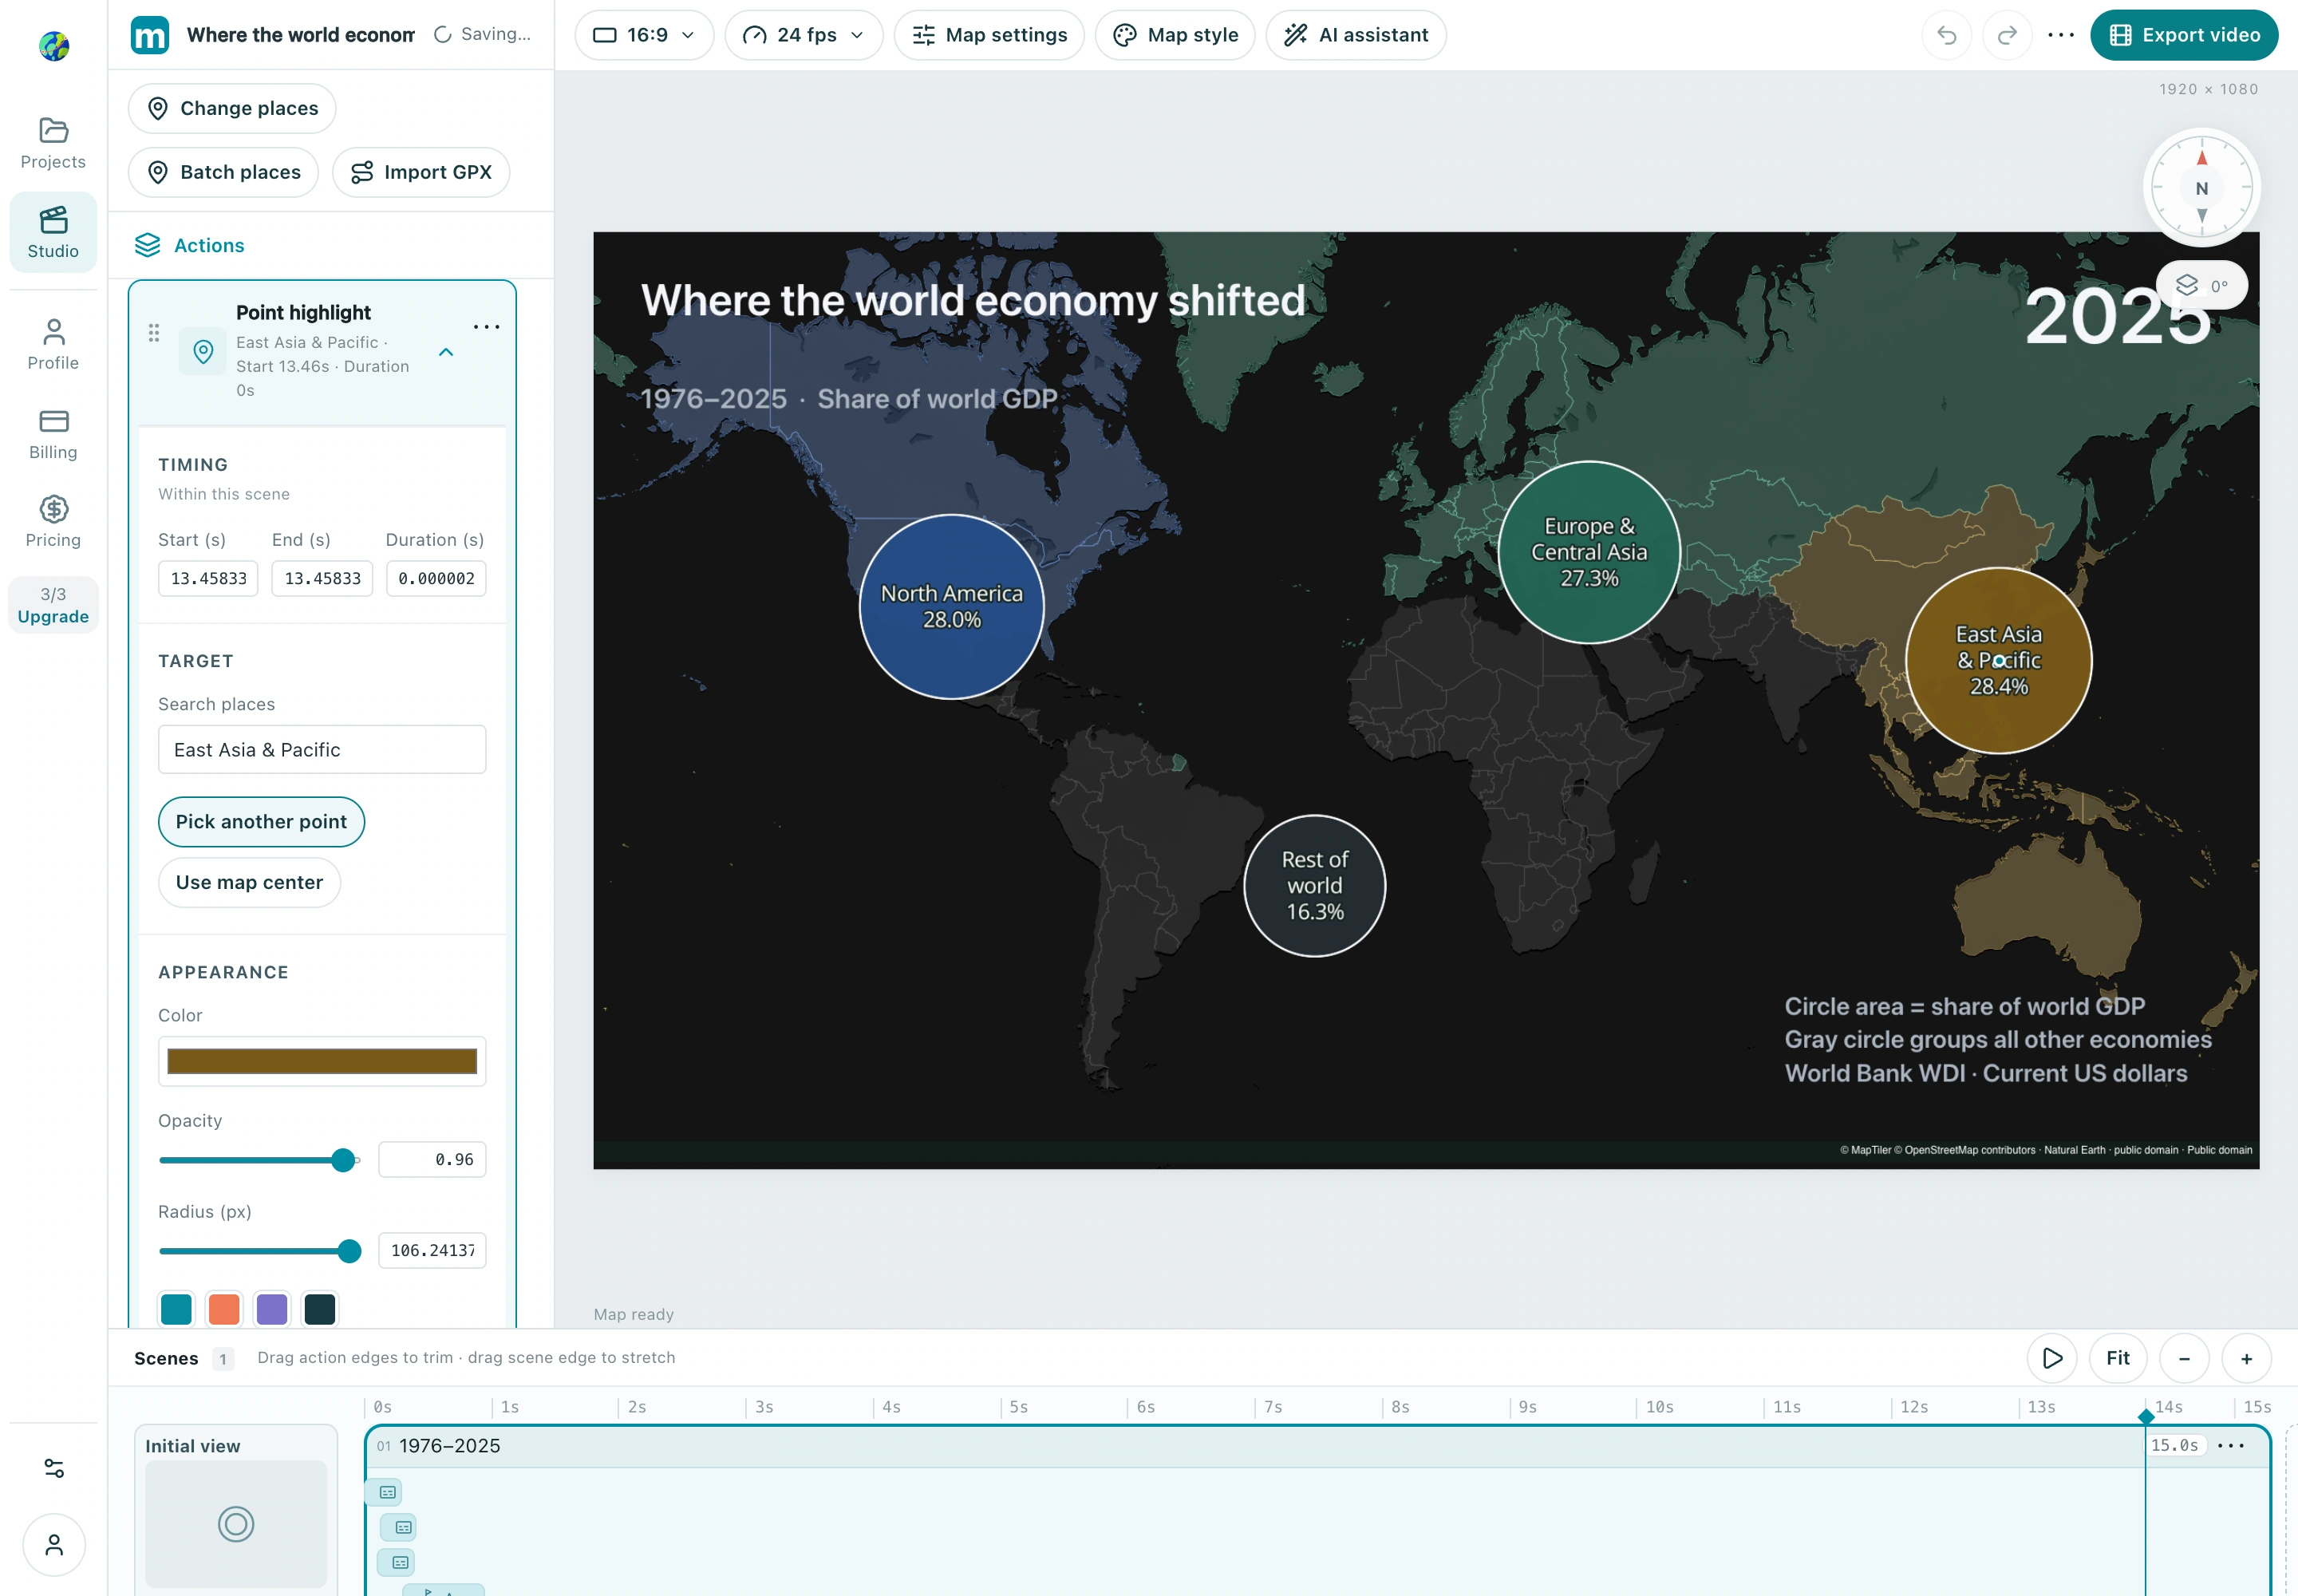
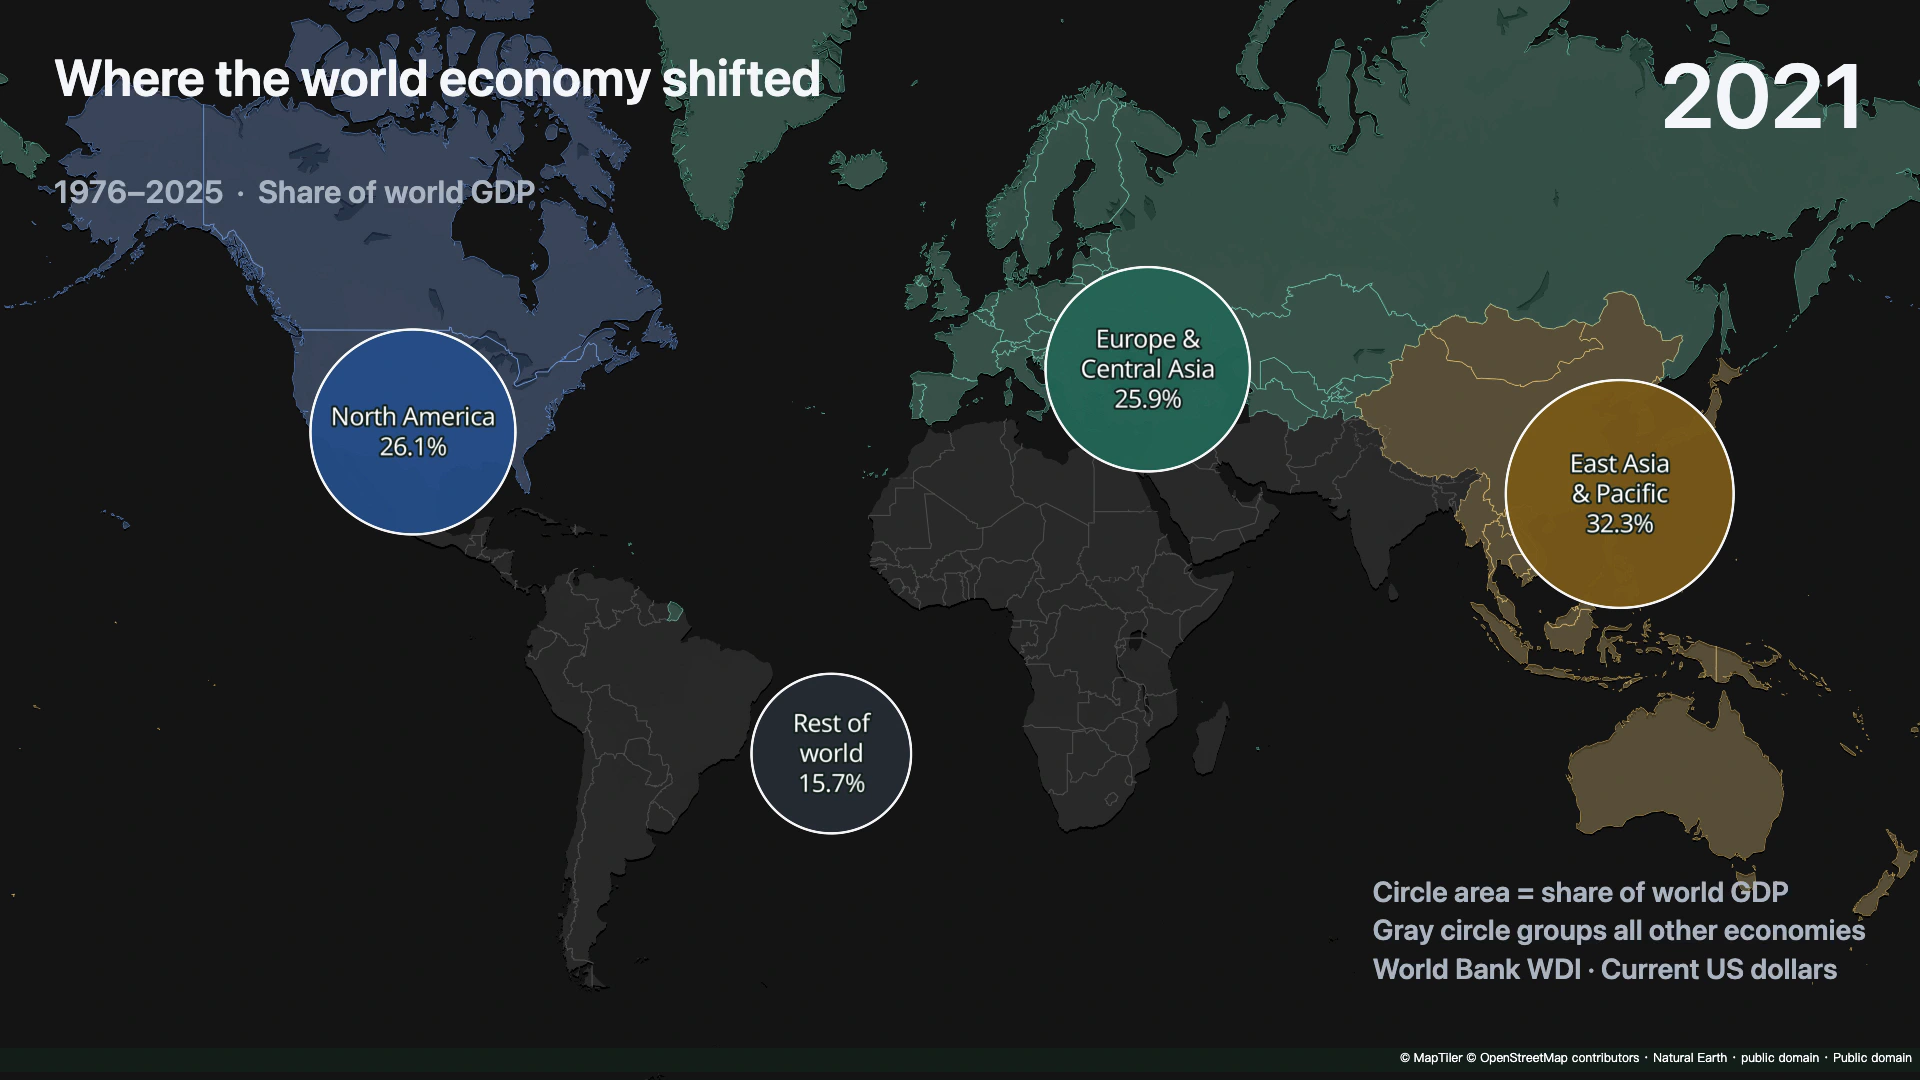
Use Point highlight for the circle and a centered Label for the name and value. For a share s expressed as a percentage, set the radius to 126 × √(s ÷ 40) pixels. Area then grows in proportion to the share. East Asia & Pacific is about 80 px at 16.1% and 106 px at 28.4%. Hide the ripple layer so the visible area has a single boundary.
Check: Check the four shares and their matching year.
4. Switch the year and export
At 24 fps, map the 45-second reference timeline to 15 seconds by dividing cumulative frame boundaries by three and rounding once. Keep all 50 years. At each boundary hide the previous marker, label, and year text as the new ones appear. Use the encoder’s integer-microsecond frame time so a nearly invisible old year cannot shift the new one downward. Preview the three key years and export 1920 × 1080 at 24 fps.
Check: Check the four shares and their matching year.
Make your own version
Replace the example with a city you know, finish a short sequence, and review it end to end. Make one clear story before adding more effects.
Practice in Studio